Contractile force in electrically stimulated human atrial pectinate muscle (PDE3 receptor)
Drug Discovery Assay – reference number: B050
Overview
| Assay type: | Cardiac muscle |
| Tissue: | Human atrial pectinate muscle (healthy) |
| Target: | PDE3 |
| Control compound: | Milrinone |
| Study type: | EFS organ bath |
| Functional endpoint: | Contractile force |
Assay Description
This assay assesses whether test compounds cause an increase in contractile force in electrically stimulated human atrial muscle with milrinone as a reference compound. Additional analyses can be undertaken to report on the rate of both contraction (dF/dt) and rate of relaxation (–dF/dt).
Pectinate muscles are mainly located in the right atrium of the heart. The muscles function to allow the atria to dilate without increased wall stress and also allow an increase in the volume of the atria.
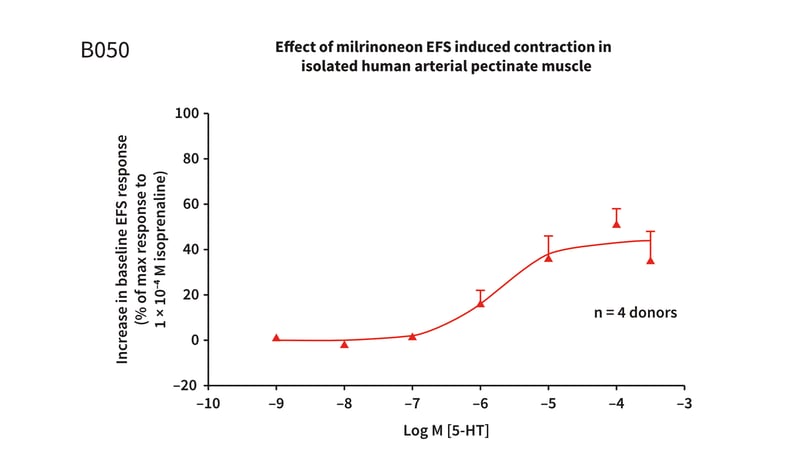
 Figure 1: Cumulative concentration response curve to milrinone in EFS stimulated (at 1Hz, pulse width 0.5ms) human atrial pectinate muscle, demonstrating a concentration dependent increase in EFS induced contractions. The Log EC50 = −5.80 ± 0.30M (1.6µM) (mean ± S.E.M), with a maximum response of 52.13 ± 7.99%.
Testing Information
Introduction
The specific results that will be provided are the effects of increasing concentrations of test articles on the contractile state of isolated human atrial pectinate muscle.
Test Article Requirements
Test article(s) to be provided by the Sponsor in storable aliquots at required test concentrations with information on diluent vehicle used. Stock solutions are prepared in distilled water unless otherwise requested. Bath volumes are 5mL; sponsor to provide sufficient test article to run the entire study.
Suggested Testing
In duplicate at 6 concentrations.
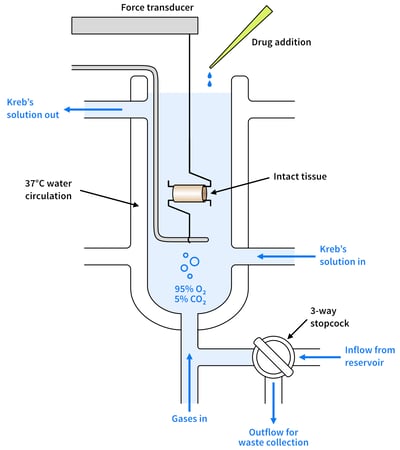
 Figure 2: A diagram showing organ bath set-up
Study Outline
Rationale and Experimental Design
This assay assesses whether test compounds cause an increase in contractile force in electrically stimulated human atrial muscle with milrinone as a reference compound. Additional analyses can be undertaken to report on the rate of both contraction (dF/dt) and rate of relaxation (–dF/dt).
Exclusion Criteria
No specific exclusion criteria are in place other than to reject macroscopically diseased/necrotic tissue. Furthermore, tissues which do not respond to the standard pharmacology checks will be excluded.
Standardisation and Qualification
All individual muscle preparations are initially processed through standardisation and qualification procedures to ensure functionality, prior to starting the study protocol.
Muscle preparations are processed through a standardisation procedure to reduce signal variability prior to electrical field stimulation and pharmacological intervention. This ensures that muscle preparations are maintained under appropriate physiological tension throughout the experiments.
Following standardisation, muscle preparations are subjected to an electrical field stimulation (EFS) voltage curve. This process determines the optimal EFS settings to be utilised during the study protocol.
Test tissues are then washed, and the EFS responses allowed to settle to steady baseline levels.
Muscle preparations which pass the standardisation and qualification pass/fail criteria will then progress to the study protocol/
Ventricular Muscle Contractility Assays
To assess their ability to modulate EFS mediated cardiac contractility, 6 point cumulative concentration response curves (CCRC’s) will be performed for each test item. These CCRC’s will be performed upon a steady baseline EFS response. A positive control compound and representative test article vehicle CCRC will also be run to allow direct comparison with test articles.
An example of the conditions assessed for 3 test articles are detailed below (each condition will be run in duplicate muscle preparations):
-
Representative test article vehicle CCRC
-
Positive control CCRC
-
Test article 1 CCRC
-
Test article 2 CCRC
-
Test article 3 CCRC
Analysis
Responses shall be expressed as % change from baseline EFS response. Statistical analysis (where appropriate) will be performed using GraphPad Prism, with the results being shown in graphical form in the final report.


