alamarBlue™ Cell Viability Assay of upcyte® hepatocyte Cultures Grown on Alvetex® Scaffold in 3D
● Download this protocol as a PDF (0.3 MB)
1. Introduction
The alamarBlue™ assay is based on the biological reduction of resazurin to the fluorescent molecule, resorufin. Resazurin is nontoxic and will readily penetrate into viable cells whereupon it is metabolised. The read-out options for the assay are absorbance or fluorescence, the latter being the more sensitive. The resazurin substrate is blue in colour and virtually non-fluorescent, resulting in very low background values in the fluorescent read out.
The amount of resorufin product increases with time and deviation from linearity can be anticipated at later time points. Therefore, it is recommended that for each cell type the linear relationship between both cell number and time, and signal produced should be first established in order to investigate the limits of the assay.
2. Methods
These are example protocols which may require further optimisation depending on the rate of cell growth of a particular cell type on Alvetex Scaffold. The protocols describe cell viability analysis of upcyte® hepatocytes (upcyte® technologies GmbH) using the alamarBlue™ Assay (Invitrogen, DAL1010, 1025, 1100). Upcyte® cells were thawed, immediately seeded onto the Alvetex Scaffolds and medium added after a 3 hour attachment period. At various time-points, the growth and viability of the upcyte® hepatocytes were monitored as described below.
2.1. Method 1: Performing the alamarBlue™ assay on dismantled Alvetex Scaffold discs
- Prepare sufficient alamarBlue™ solution for the experiment, including controls, by diluting 1/10 in appropriate phenol red-free medium.
- Remove the Alvetex Scaffold disc from the culture vessel and dismantle inserts where applicable. For 22 mm Alvetex Scaffold discs, transfer to the wells of a clean 12 well plate. For 15 mm Alvetex Scaffold discs, transfer to the wells of a clean 24 well plate.
- For 22 mm Alvetex Scaffold discs add 0.8 mL of diluted alamarBlue™ solution to each well. Also add 0.8 mL diluted alamarBlue™ solution to empty control wells containing no cells. For 15 mm Alvetex Scaffold discs add 0.4 mL of diluted alamarBlue® solution to each well. Also add 0.4 mL diluted alamarBlue™ solution to empty control wells containing no cells.
- Incubate samples at 37 °C and 5 % CO2 for 1 hour.
- Transfer 100 μl aliquots of each sample to replicate wells of a black 96 well plate.
- Measure fluorescence at 590 nm, using an excitation wavelength of 530-560 nm.
2.2. Method 2: Performing the alamarBlue™ assay on Alvetex Scaffold in situ in well inserts
- Prepare sufficient alamarBlue™ solution for the experiment, including controls, by diluting 1/10 in appropriate phenol red-free medium.
- Remove the Alvetex Scaffold insert from the culture vessel and transfer to a clean plate. For 22 mm Alvetex Scaffold inserts, transfer to a clean 6 well plate. For 15 mm Alvetex Scaffold inserts, transfer to a clean 12 well plate.
- For 22 mm Alvetex Scaffold inserts add 7 mL of diluted alamarBlue™ solution to each well. For 15 mm Alvetex Scaffold inserts add 3 mL of diluted alamarBlue™ solution to each well. Add the same corresponding volume of diluted alamarBlue™ solution to empty control wells containing no cells.
- Incubate samples at 37 °C and 5 % CO2 for 3 hours.
- Transfer 100 μL aliquots of each sample to replicate wells of a black 96 well plate.
- Measure fluorescence at 590 nm, using an excitation wavelength of 530-560 nm.
3. Example Data Set
The example data shown below was obtained from cultures of upcyte® hepatocytes (Medicyte) grown in 15 mm Alvetex Scaffold presented in 12 well insert format.
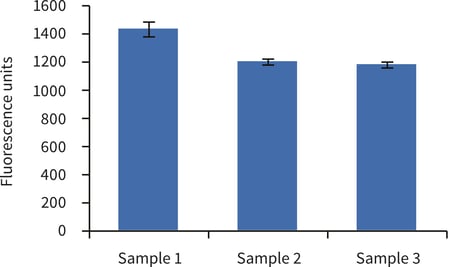
Figure 1. Biochemical analysis of cell viability using the alamarBlue™ assay according to Method 2, above. Data from 3 sample replicates of upcyte® hepatocytes cultured in Alvetex Scaffold in 12 well insert format are shown (n = 3, mean ± SD). Note good reproducibility between samples.
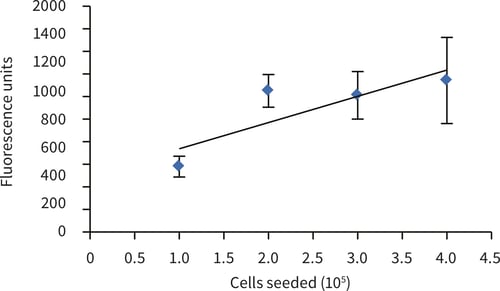
Figure 2. alamarBlue™ assay of upcyte® hepatocytes cultured for 5 hours in Alvetex Scaffold discs presented in 12 well insert format (n = 3, mean ± SD). Correlation is shown between cell number and fluorescent signal at seeding densities of 1.0, 2.0, 3.0 and 4.0 × 10⁵ cells per disc (R2 > 0.71).
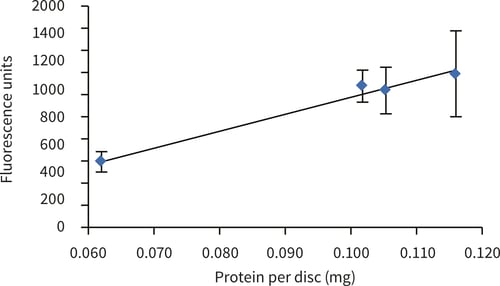
Figure 3. alamarBlue™ assay of upcyte® hepatocytes cultured for 5 hours in Alvetex Scaffold discs presented in 12 well insert format (n = 3, mean ± SD). Data normalised to protein extracted from Alvetex Scaffold discs seeded at 1.0, 2.0, 3.0 and 4.0 × 10⁵ cells. Good linearity was observed (R2 = 0.98) between cellular protein and alamarBlue™ fluorescence reading.