Induced Atopic Dermatitis Model
Drug Discovery Assay – reference number: B121
| Assay type: | Skin |
| Tissue: | Human skin biopsies (healthy) |
| Target: | TH2 pathway |
| Control compound: | Betamethasone |
| Study type: | Ex vivo cultures |
| Functional endpoint: | Inflammation |
Assay Description
This experiment assesses whether test articles cause a reduction in inflammatory cytokine release in atopic dermatitis, with Betamethasone as a reference compound. It uses healthy skin punch biopsies which are induced to display an atopic dermatitis phenotype using a cocktail which activates the TH2 pathway. We then explore test article effect on the expression on inflammatory cytokines via ELISA and/or rtPCR.
Testing Information
Introduction
The specific results that will be provided are on the anti-inflammatory effect of test articles across an induced atopic dermatitis model using human fresh skin.
Test Article Requirements
Test article(s) to be provided by the Sponsor in storable aliquots at required test concentrations with information on diluent vehicle used. Stock solutions are prepared in deionized water unless otherwise requested. Sponsor to provide sufficient test article to run the entire study.
Suggested Testing
We suggest test conditions are assessed in triplet as a minimum.
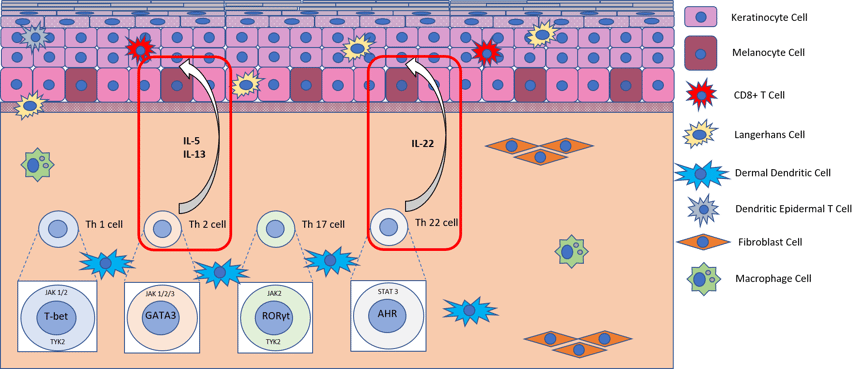
Diagram showing the intracellular pathway activated by our atopic dermatitis cocktail in healthy skin
Rationale and Experimental Design
Option 1: Systemic administration of test article
Full-thickness skin biopsies are achieved via punch-biopsy of residual surgical tissue. Biopsies are taken at a size of 3mm2 and transferred onto a mesh transwell in a 12 well plate. The dermis of the skin is submerged in specially fortified media, leaving the epidermis exposed to air. Biopsies are incubated in optimum conditions for a maximum of 24 hrs, then cultured in the presence of the inflammatory cocktail and the test article for a further 24 hrs. Tissue media is collected for phenotype analysis by ELISA and/or the biopsy set is collected for rtPCR.
An example of the conditions assessed for 3 test articles are detailed below (it is recommended a minimum of triplicates should be used for each condition):
- Non-stimulated control
- Stimulated control
- Test article 1
- Test article 2
- Test article 3
- Positive control
Option 2: Topical application of test article
Full-thickness skin biopsies are achieved via punch-biopsy of residual surgical tissue. Biopsies are taken at a size of 8mm2 and transferred onto a mesh transwell in a 12 well plate. The dermis of the skin is submerged in specially fortified media, leaving the epidermis exposed to air. Biopsies are incubated in optimum conditions for a maximum of 24 hrs, then cultured in the presence of the inflammatory cocktail (added to the media) and the test article (added to the exposed skin surface) for a further 48 hrs. Tissue media is collected for phenotype analysis by ELISA and/or the biopsy set is collected for rtPCR.
An example of the conditions assessed for 3 test articles are detailed below (it is recommended a minimum of triplicates should be used for each condition):
- Non-stimulated control
- Stimulated control
- Test article 1
- Test article 2
- Test article 3
- Positive control
Exclusion Criteria
No specific exclusion criteria are in place other than to reject macroscopically diseased/necrotic tissue.
Standardization and Qualification
Tissue that does not respond to stimulation with LPS would be deemed non-functional.
Analysis
Cytokine analysis: Supernatant samples can be analyzed for specific analytes of your choice by a multiplex ELISA platform. Each analyte will be quantified by interpolation against a standard curve generated on the same 96 well analysis plate.
Other forms of end point analysis are available such as gene expression or immunohistochemistry.
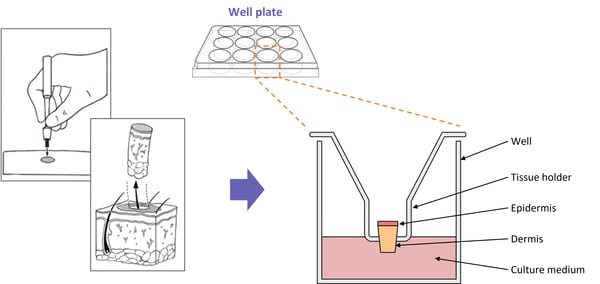
Diagram showing the typical set-up for one of our induced AD models.
Example data from induced atopic dermatitis model

Induction of IL-13, IL-5 and IL-22 secretion after 48 h: Data is presented as mean ± SEM in bar format with the individual donor means presented in the scatter. Analysis was conducted by two-way ANOVA. Three subjects were evaluated in quadruplicate measurements. Multiple comparisons were evaluated with the Dunnett’s test. Asterisks indicate significant (P < 0.05, for one, P < 0.01 for two, P < 0.001 for three and P < 0.0001 for four) differences versus the control group.
|
Drug Treatment
|
Mechanism and information
|
|
Betamethasone
|
Corticosteroid standard of care treatment for AD
|
|
CP690550 (also known as tofacitinib)
|
A Pfizer JAK1/JAK3 inhibitor. JAK1 and JAK3 are key signalling molecules in Th2 cell differentiation.
|
|
AN2728 (also known as crisaborole)
|
An Anacor PDE4 inhibitor. First topically applied PDE4 inhibitor to be approved by the FDA for use in AD.
|
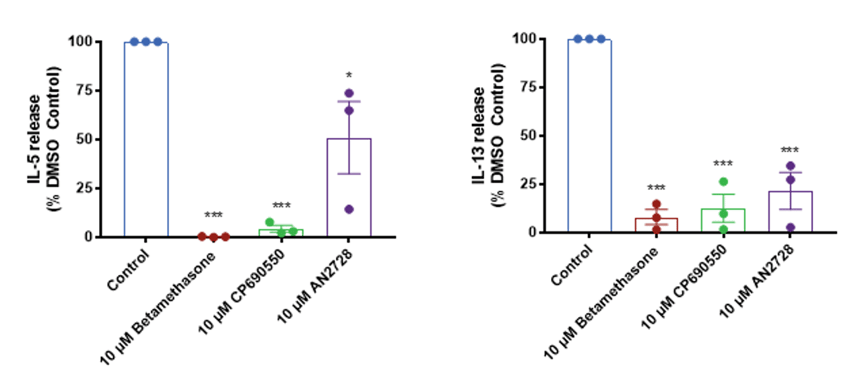
AD Phenotype Modulated by Treatment: Cytokine release data: Data is presented as mean ± SEM in bar format with the individual donor means presented in the scatter. Analysis was conducted by two-way ANOVA. Three subjects were evaluated in quadruplicate measurements. Multiple comparisons were evaluated with the Dunnett’s test. Asterisks indicate significant (P < 0.05, for one, P < 0.01 for two, P < 0.001 for three and P < 0.0001 for four) differences versus the control group.
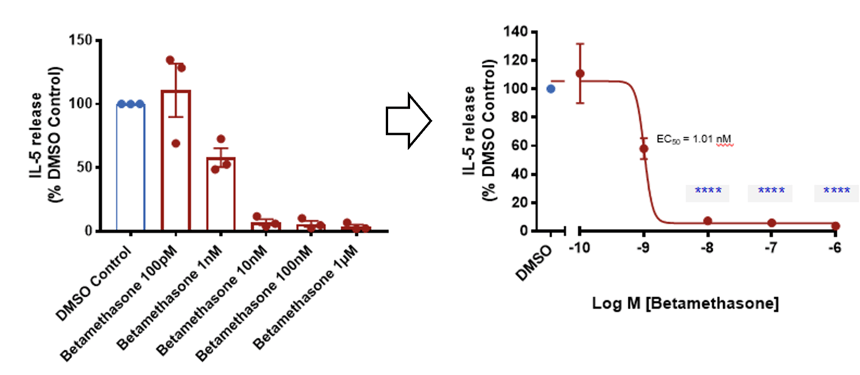
Inhibition by Increasing Concentrations of Betamethasone. Left: Data is presented as mean ± SEM in bar format with the individual donor means presented in the scatter. Three subjects were evaluated in quadruplicate measurements. Right: Data is presented as mean ± SEM with the data fitted and EC50 calculated using a non-linear four parameter curve fit. Analysis was conducted by two way ANOVA . Multiple comparisons were evaluated with the Dunnett’s test. Asterisks indicate significant (P < 0.05, for one, P < 0.01 for two, P < 0.001 for three and P < 0.0001 for four) differences versus the DMSO control group.
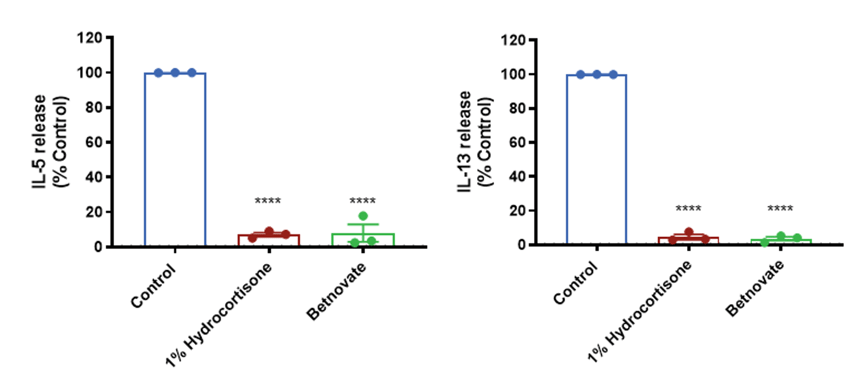
Topical Application of SOC formulations: Data is presented as mean ± SEM in bar format with the individual donor means presented in the scatter. Analysis was conducted by two-way ANOVA. Three subjects were evaluated in quadruplicate measurements. Multiple comparisons were evaluated with the Dunnett’s test. Asterisks indicate significant (P < 0.05, for one, P < 0.01 for two, P < 0.001 for three and P < 0.0001 for four) differences versus the untreated control group.

.jpg?width=756&height=425&name=Untitled%20design%20(10).jpg)
