Determination of Cell Number and Growth Characteristics within Alvetex® Scaffold using the PicoGreen® Assay
● Download this protocol as a PDF (0.3 MB)
1. Introduction
The following protocol outlines a method for determining cell numbers within Alvetex Scaffold using the PicoGreen® Assay. PicoGreen® is an ultrasensitive (± 50 cells) fluorescent nucleic acid dye which provides linear results over multiple orders of magnitude with a single dye concentration. It is therefore the dye of choice over Hoescht and DAPI for this type of quantitative assay. Example data was obtained using this protocol with HepG2 hepatocytes cultured in Alvetex Scaffold for 7 days.
2. Method
- To create a cell number standard curve, harvest cells from 2D cultures using an appropriate detachment method.
- Count cells and re-suspend appropriate cell number ranges in 1 mL lysis buffer (10 mM Tris pH 8, 1 mM EDTA and 0.2 % (v/v) Triton X-100).
Note: Always work RNase and DNase free where possible.
- Vortex samples for 10 seconds every five minutes for half an hour, keeping on ice throughout. Thaw on ice, if required, and homogenise samples 10-15 times using a 21-guage needle.
Note: At this point samples can be stored at –80 °C until the assay is ready to be performed.
- Prepare 1 × TE buffer (10 mM Tris-HCl, 1 mM EDTA) from 20 x stock (200 mM Tris-HC l, 20 mM EDTA, pH 7.5) (Quant-iTTM PicoGreen® dsDNA reagent kit, Invitrogen) and 1 × PicoGreen® reagent from 200 × stock in 1 × TE buffer.
- Dilute samples 1 in 10 in 1 × TE buffer by placing 90 μL of 1 × TE buffer and 10 µL of sample into the well of a black bottom 96-well plate.
- Add 100 μL of PicoGreen® reagent, mix and incubate at room temperature for 5 minutes wrapped in aluminium foil.
- Read fluorescence measured at excitation and emission wavelengths of 460 nm and 540 nm respectively, using a Biotek FLx800 fluorescence micro-plate reader, or equivalent.
- For cells cultured in Alvetex Scaffold, wash in PBS and remove disc from culture format used using forceps and place in a 1.5 mL tube.
- Lyse cells with 1 ml of lysis buffer as described in step 3.
- Repeat step 4 keeping the Alvetex Scaffold disc within the 1.5 mL tube when homogenising.
- Place cell lysate in fresh 1.5 mL tube.
- Repeat steps 5-8 for analysis.
3. Example Data Set
Cell Number Determination and Growth Curve of HepG2 Cells Cultured in 22 mm Alvetex Scaffold Discs in 6-Well Insert Format (AVP004).
3.1. Cell Culture
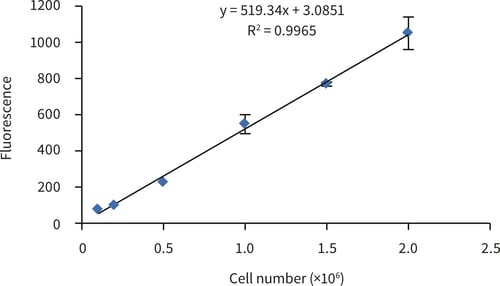
For the generation of a standard curve for cell number determination; cells retrieved from conventional 2D culture flasks were prepared as a series: 0.1, 0.2, 0.5, 1.0, 1.5 and 2.0 × 10⁶ and analysed as described above. Figure 1 shows the linear response of PicoGreen® fluorescence to cell number between 0.1 × 10⁶ and 2.0 × 10⁶ cells.
HepG2 cells were routinely maintained in T75 flasks. HepG2 complete media consisted of MEM media (Gibco, 21090) containing 10 % v/v FBS, 2 mM L-glutamine and 100 U/mL Penicillin/ streptomycin. Cells were harvested by trypsinisation and centrifuged at 1000 rpm for 5 minutes. Cells were seeded onto 22 mm Alvetex Scaffold discs in 6-well insert format at a cell density of 8 × 10⁶ cells / mL (1 × 10⁶ cells / 125 μL). Cell aliquots were allowed to settle for 30 minutes prior to flooding the wells with 10 mL of complete HepG2 culture medium.
Media changes were performed every day for up to 7 days.
4. Results

Figure 1. HepG2 cell number standard curve determined using the PicoGreen® assay (Quant-iTTM PicoGreen® dsDNA reagent kit, Invitrogen), HepG2 cells were harvested from conventional 2D T75 culture flasks and counted using a haemocytometer and Trypan Blue dye exclusion. Serial dilutions were made to give appropriate cell, seeding numbers. (Error bars ± SE, n = 3)

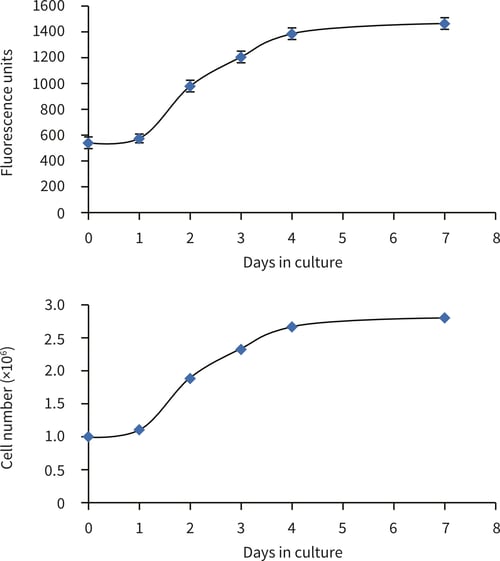
Figure 2. HepG2 cell number in 22 mm Alvetex Scaffold discs in 6-well insert format (AVP004). Cell numbers were calculated from the cell number standard curve using the PicoGreen® assay (Quant-iTTM PicoGreen® dsDNA reagent kit, Invitrogen). HepG2 cells were cultured for 1, 2, 3, 4 and 7 days. (Error bars ± SE, n = 6 for fluorescence output.)

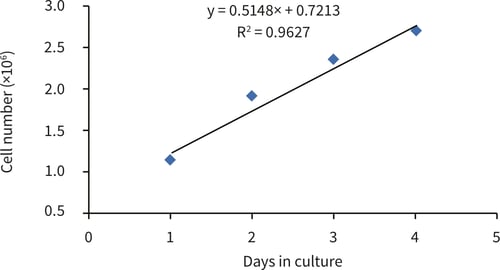
Figure 3. Log phase region of HepG2 growth curve between 1-4 days in culture.
5. Conclusions
The PicoGreen® assay can be used to evaluate the growth characteristics of HepG2 cells cultured on 22 mm Alvetex Scaffold discs in 6-well insert format. HepG2 cells show an initial lag phase for 24 hours before moving into log phase growth, with a population doubling time of just over 48 hours (from gradient evaluation, 56 hours). After 4 days of culture HepG2 cell growth slows with a plateau region showing no increase in cell population between 4 and 7 days.
This method is a useful approach to determine cell number within a 3D culture.