Alvetex® Scaffold 96 Well Plate: Instructions for Use and Example Applications
● Download this protocol as a PDF (7 MB)
1. Overview
Three-dimensional (3D) cell culture models are becoming a popular alternative to bridge the gap between conventional 2D culture assays and animal models. Such 3D systems represent a more realistic approach, enabling cells to retain their native 3D morphology, form interactions with adjacent cells and create more complex structures. Alvetex Scaffold provides the ideal environment for cells to grow and function in 3D, creating a more representative tissue model. The material consists of a highly porous and inert polystyrene scaffold with multiple voids and interconnects creating a 3D environment into which cells can freely grow and occupy, creating 3D structures in vitro.
REPROCELL’s Alvetex Scaffold 96 well plate (AVP009) technology is reproducible and compatible with a variety of in vitro cell viability assays and offers the advantage of assay multiplexing, which may not be possible for such techniques used in cancer cell biology models, such as clonogenic assays.
2. Product description
REPROCELL’s Alvetex Scaffold 96 well plate format is comprised of a black plate, clear plastic base, with Alvetex Scaffold at the bottom of each well. The Alvetex Scaffold has been heat welded to the base of the wells in a process which does not alter its physical structure. Cells growing in 3D are exposed to culture medium from above only, and therefore predominantly reside in the top portion of scaffold. As with 2D culture, if using serum-free medium, the use of coating reagents to enhance cell growth can be considered.
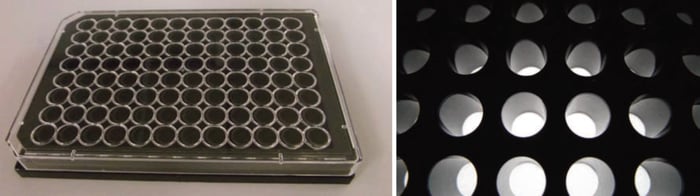
Figure 1. Alvetex Scaffold in 96 well plate format.
This document is a summary of the evaluation work that has been carried out to optimise protocols for the growth and drug response of various cell types in 3D cell culture using Alvetex Scaffold 96 well plate technology. The work primarily focuses on cell viability analyses to monitor cytotoxicity in various cancer cell lines.
3. Assays used to assess cell viability
The measurement of cell viability plays an essential role in many aspects of cell culture. It is the main measurement in cell cytotoxicity assays and can also be used to correlate cell number to cell behaviour. Cell viability is defined as the number of healthy cells and can be continually measured to determine proliferation within a certain cell population.
Assays which rely on the metabolic activity of cells are gaining favour as they can be performed on adherent cells and lend themselves to more high throughput analysis. The final measurement can also be made using a plate reader and provides an advantage when screening large treatment groups. The most commonly used metabolic dye is 3-(4,5-dimethylthiazol-2-yl)-2,5- diphenyltetrazolium bromide (MTT). This assay relies on the conversion of the soluble tetrazolium into the insoluble blue formazan product. Although it is generally believed this conversion takes place within the mitochondria of the cells, there is increasing evidence that this is not entirely the case. Other similar dyes such as XTT (2,3-bis-(2-methoxy-4-nitro-5-sulfophenyl)-2H-tetrazolium-5- carboxanilide) and MTS 3-(4,5-dimethylthiazol-2-yl)-5-(3-carboxymethoxyphenyl)-2-(4- sulfophenyl)-2H tetrazolium are used in the presence of phenazine methosulphate (PMS), which increases their sensitivity. The major advantage of these derivatives is that they require fewer analytical steps for analysis as the product is released into the culture medium, eliminating the need to dissolve the insoluble product. Nonetheless, MTT is an extremely robust assay and is metabolised by almost all cell types.
Resazurin based methods (alamarBlue™) are also frequently used and offer the advantage that they can be either read by colourimetry or fluorimetry. Greater sensitivity is offered with fluorescence output, where as few as 80 cells can be measured. Care must be taken at higher cell numbers to avoid the over-reduction of the alamarBlue™ to the colourless and non-flourescent hydroresorufin.
3.1. Preparation of Alvetex Scaffold 96 well plate format
-
Remove the 96 well plate (AVP009) from the blister pack within a sterile environment.
-
Add approximately 100 µL of 70 % ethanol to each well to prepare the scaffold.
-
Carefully aspirate the 70 % ethanol solution and add 200 µL of appropriate culture medium or PBS. (This step should be performed immediately after the addition of the 70 % ethanol. Evaporation of the ethanol solution may lead to the scaffold drying out).
-
Carefully aspirate and replace with the final wash medium (use the same type of medium as for cell seeding). The Alvetex Scaffold is now ready for cell seeding.
-
Aspirate the medium just before application of cells. If preparation of the cell suspension is delayed, incubate the plate with medium at 37 °C with 5 % CO2 until ready for use.
3.2. Optimising cell seeding and 3D culture using Alvetex Scaffold 96 well plate format
-
Use standard 2D subculture and detachment methods to prepare the cells for inoculation into the 96 well Alvetex Scaffold plate.
-
3D cell culture is different to conventional 2D culture and as such requires optimisation according to cell type.
-
For the best results it is recommended to optimise cell seeding density in the first instance. We have previously demonstrated that between 5,000 and 100,000 cells be seeded per well in the final culture volume (e.g. 200 µL per well). This will depend on the nature of the cell type and its appropriate growth conditions. Typically seeding cells in the range of 10-30,000 cells per well is a good starting point. Note that a 1 hour incubation at room temperature prior to culture at 37 °C may improve the uniformity of cell coverage on each scaffold. Media changes can be performed every 1-2 days but this is dependent on cell type and growth characteristics. Media changes should ideally be performed every ≥ 2 days to reduce any temperature variability which may be caused by repeated removal of the plate from the incubator.
-
When inoculating, aspirate the washing medium carefully and thoroughly from the plate and gently dispense the cell suspension into each well using either seeding method. Replace the lid and incubate in a humidified incubator at conditions appropriate for the cell type (e.g. 37°C with 5 % CO2).
-
3D cultures can support the growth of more cells per unit volume of medium; therefore media may need to be replaced more frequently. Media may need to be changed once a day. However this will depend on the population doubling rate and nutrient demands of the cell type cultured. Every 2 days may suffice for short term cultures.
-
The length of culture will also depend upon cell type and the type of experimental analysis to be performed. However, based on the following preliminary data an incubation period of up to 5 days may be optimal.
4. Standard Assay protocols using Alvetex Scaffold 96 well plate technology
The following cell types and viability assays have been evaluated on Alvetex Scaffold 96 well plate technology (Tables 1 and 2). All plates were prepared for seeding as described in Section 3.1. All assays reported herein were run on the Biotek ELx800 microplate reader.
| Cell lines evaluated | Cell line supplier | Product code |
|---|---|---|
| HepG2 | ATCC | HB-8065 |
| HaCaT | DKFZ | L-10259 |
| SW620 | ATCC | CCL-227 |
| PC-3 | ATCC | CRL-1345 |
| LN-229 | ATCC | CRL-2261 |
| MCF-7 | ATCC | HTB-22 |
Table 1
| Viability assays evaluated | Assay Supplier | Product code |
|---|---|---|
| MTT | Sigma | M5655-1G |
| MTS CellTiter 96® Aqueous One Solution Cell Proliferation Assay | Promega | G3580 |
| XTT | ATCC | 30-1011K |
| alamarBlue™ | AbD Serotec | BUF012B |
| Neutral Red | Sigma | N4638-1G |
Table 2
4.1. MTT cell viability assay
This chromogenic assay involves the conversion of a yellow, water soluble compound, MTT (3-(4,5-Dimethylthiazol-2-yl)-2,5-diphenyltetrazolium bromide, a tetrazole) to a purple, insoluble formazan. This reaction only takes place when mitochondrial reductase enzymes are active, and therefore the conversion can be directly related to the number of viable (living) cells. The MTT reagent alone results in very low background absorbance values in the absence of cells on Alvetex Scaffold. It is recommended that for each cell type the linear relationship between cell number and signal produced should be first established in order to investigate the limits of the assay. This is an example protocol, which may require further optimisation depending on the rate of cell growth of a particular cell type on Alvetex Scaffold.
4.1.1. Method
-
Dissolve the MTT reagent in phenol red-free medium (1mg / mL) and filter sterilise (0.2 µm filter).
-
Remove the culture medium from the plates by aspirating and wash the experimental wells with 200 µL of PBS.
-
Add 200 µL of the MTT reagent to each well and incubate in the dark at 37 °C with 5 % CO2 for 1 hour.
-
Remove the MTT reagent by aspirating and replace with 200 µL acidified isopropanol (1 µL concentrated hydrochloric acid per 1 mL isopropanol). Agitate the solution in each well by pipetting up and down to ensure blue formazan product has fully solubilised (see Section 8.0 for Troubleshooting).
-
Remove 100 µL of the product and place into a fresh 96 well plate.
-
Read the absorbance at 570 nm.
4.1.2. Example data
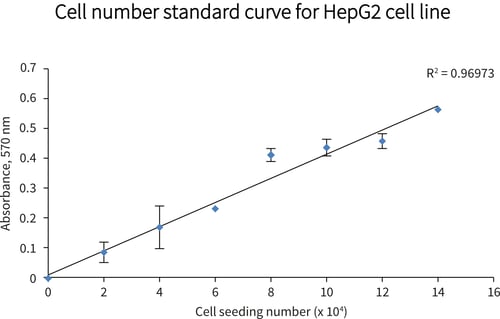
Figure 2. Cell viability as a function of cell seeding density (MTT assay). HepG2 cells were seeded at a range of densities onto Alvetex Scaffold 96 well plate format and incubated for 24 hours prior to analysis: linear increase in absorbance with increasing cell seeding density was observed for up to 140,000 cells per well. Data from 3 sample replicates are shown (n = 3, mean ± SD), from cultures maintained within 96 well plates.
4.2. MTS cell viability assay
This chromogenic assay involves the biological reduction by viable cells of the tetrazolium compound 3-(4,5-dimethylthiazol-2-yl)-5-(3-carboxymethoxyphenyl)-2-(4-sulfophenyl)-2H tetrazolium (or MTS). The MTS assay reagent is composed of MTS and the electron coupling agent phenazine methosulfate (PMS). The formazan product of MTS reduction is soluble in tissue culture medium. This reaction only takes place when mitochondrial reductase enzymes are active, and therefore the conversion can be directly related to the viability of cells in culture. The MTS reagent alone results in very low background absorbance values in the absence of cells. It is recommended that for each cell type the linear relationship between cell number and signal produced should be first established in order to investigate the limits of the assay. This is an example protocol, which may require further optimisation depending on the rate of cell growth of a particular cell type on Alvetex Scaffold.
4.2.1. Method
-
Use assay as described by manufacturer’s protocol. MTS CellTiter 96® Aqueous One Solution Cell Proliferation Assay. (See http://www.promega.com/resources/protocols/technical-bulletins/0/celltiter-96-aqueous-one-solution-cell-proliferation-assay-system-protocol/ .)
-
Add 20 µL of MTS reagent per 100 µL of culture medium and incubate for 1 hour at 37 °C with 5 % CO2, wrapped in tin foil.
-
After 1 hour incubation remove an appropriate volume of product and read absorbance at 490 nm in a fresh 96 well plate (2D).
4.2.2. Example data
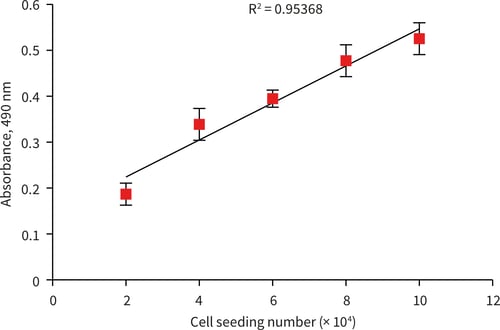
Figure 3. MTS standard curve for HepG2 cells (0-100,000 cell number) after 24 hours incubation. 100 µL of MTS product removed and absorbance read at 490 nm (n = 3, ± SEM).
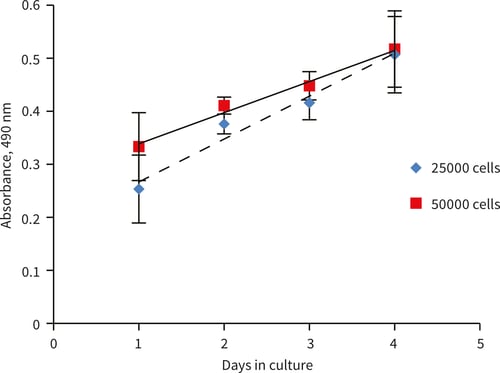
Figure 4. MTS growth curves for HepG2 cells grown on Alvetex Scaffold 96 well plate for up to
4 days. HepG2 cells showed good linear cell growth. 100 µL of MTS product was removed and read at 490 nm (n = 3, ± SD). Linear HepG2 growth was observed for up to 4 days at both 25,000 and 50,000 cells per well seeding density (R2 = 0.963 and 0.985 respectively).
4.3. alamarBlue™ assay
The alamarBlue™ assay incorporates a fluorometric/colourimetric growth indicator based on detection of metabolic activity. Specifically, the system incorporates an oxidation-reduction (REDOX) indicator that both fluoresces and changes colour in response to chemical reduction of growth medium resulting from cell growth.
As cells being tested grow, innate metabolic activity results in a chemical reduction of alamarBlue™. Continued growth maintains a reduced environment whilst inhibition of growth maintains an oxidized environment. Reduction related to growth causes the REDOX indicator to change from oxidized (nonfluorescent, blue) form to reduced (fluorescent, red) form. It is recommended that for each cell type the linear relationship between cell number and signal produced should be first established in order to investigate the limits of the assay. This is an example protocol, which may require further optimisation depending on the rate of cell growth of a particular cell type on Alvetex Scaffold.
4.3.1. Method
-
Dilute the alamarBlue™ 1 in 10 in Dulbecco’s phosphate buffered saline (PBS) solution.
-
Remove culture medium from 96 well plate wells and wash experimental wells with 200 µL of PBS.
-
Add 250 µL of alamarBlue™ reagent diluted in PBS per well of the 96 well plate.
-
Incubate for 1 hour at 37 °C with 5 % CO2 on a shaker platform at 100 rpm.
-
Remove 100 µL of product and place into a fresh 96 well plate.
-
Read absorbances at 570 and 600 nm respectively.
-
Calculate the percent reduced amount of alamarBlue™ reagent as described in the manufacturer’s protocol, (https://www.bio-rad-antibodies.com/static/uploads/ifu/buf012a.pdf ).
4.3.2. Example data
A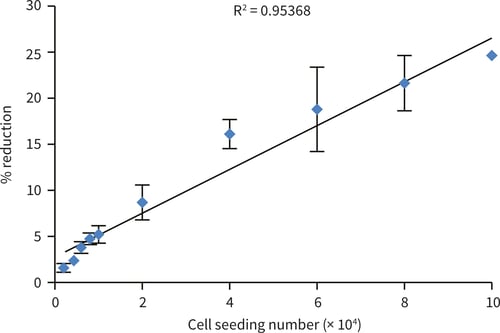
B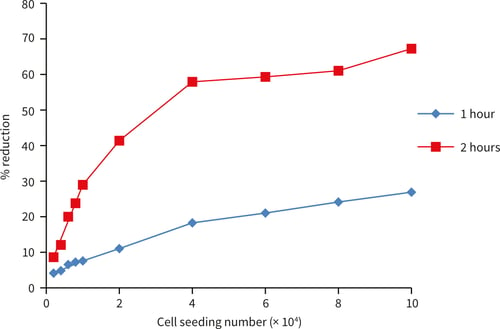
Figure 5. HepG2 cells seeded at an increasing cell number (2,000-100,000 cells/well). The alamarBlue™ assay shows good linearity up to 100,000 cells/well (A) after 1 hour incubation. Further incubation up to 2 hours (B) shows a plateau of alamarBlue™ reduction around 40,000 cells per well (n = 3, ± SEM).
4.4. XTT cell viability assay
This chromogenic assay involves the reduction of XTT (2,3-bis-(2-methoxy-4-nitro-5-sulfophenyl)-2H-tetrazolium-5-carboxanilide) to form an orange coloured formazan derivative. Although mitochondrial oxidoreductases are thought to contribute significantly to this conversion, actual reduction of XTT is believed to occur at the extracellular surface of the plasma membrane, where the sensitivity of the assay can be enhanced by addition of the intermediate electron carrier, PMS (N-methyl dibenzopyrazine methyl sulphate). This results in the colour change taking place directly in the culture medium without cellular import of the XTT substrate. Therefore, the XTT reagent is suitable for use in real time metabolic viability assays. It is recommended that for each cell type the linear relationship between cell number and signal produced should be first established in order to investigate the limits of the assay. This is an example protocol, which may require further optimisation depending on the rate of cell growth of a particular cell type on Alvetex Scaffold.
4.4.1. Method
-
Prepare activated XTT solution by adding 0.1 mL Activation Reagent per 5.0 mL XTT reagent according to the manufacturer’s instructions (ATCC, 30-1011K).
-
Withdraw media from each well of the Alvetex Scaffold 96 well plate and replace with fresh media mixed 2:1 with Activated XTT reagent (100 µL media plus 50 µL Activated XTT reagent = 150 µL total volume per well). Alternatively leave existing media in place and add 50 µL of Activated XTT reagent directly to each well.
-
Include a blank control (no cells) well containing 100 µL medium plus 50 µL activated XTT solution only. Incubate plate for 1-2 hours at 37 °C with 5 % CO2.
-
Sample a 100 µL aliquot from each well directly into separate wells of a 96 well plate.
-
Using a microtiter plate reader measure the absorbance of all wells first at a wavelength of
between 450-500 nm, and then at a wavelength between 630-690 nm (for non-specific readings). (In this example, reading 1 was performed at 450 nm and reading 2 was performed at 630 nm).
-
Calculate specific absorbance as follows:
Specific Absorbance = A450nm (sample) − A450nm (blank) − A630nm (sample)
4.4.2. Example data
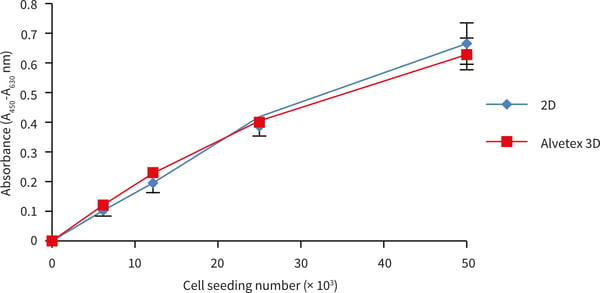
Figure 6. HepG2 cells cultured in Alvetex Scaffold in 96 well plate format. XTT assay cell seeding density standard curve. HepG2 cells were cultured for 1 day on Alvetex Scaffold in 96 well plate format. Triplicate cultures were prepared at a range of seeding densities (n = 3, mean ± SEM). Specific absorbance values were comparable between 2D controls and 3D Alvetex Scaffold cultures up to a seeding density of 50,000 viable cells per well (as determined by trypan blue exclusion assay).
4.5. Protein Extraction from Cells
4.5.1. Introduction
This protocol describes the use of a commercial protein extraction reagent to obtain protein samples from cells cultured in Alvetex Scaffold 96 well plate format (AVP009). Using this method, quantitative protein extraction is achievable over wide ranging cell densities. Resulting protein extracts are compatible with common downstream techniques, including Bradford and BCA protein assays, SDS-PAGE and western blotting, non-denatured immunological applications (e.g. immunoprecipitation), and enzymatic assays.
4.5.2. Method
This is an example protocol, based on 3D culture of MDA-MB-231 breast cancer cells in Alvetex Scaffold in 96 well plates. Total protein was extracted using the Mammalian Protein Extraction Reagent (M-PER) from Pierce (product code 78503, https://www.thermofisher.com/order/catalog/product/78503?SID=srch-srp-78503).
- Withdraw culture medium from each well of the Alvetex Scaffold 96 well plate.
Note: The M-PER reagent can be supplemented with protease inhibitors (e.g. Pierce, 87785) to minimise protein degradation upon release of cellular proteases.
-
Rinse cells by carefully adding 200 µL PBS per well, aspirate to waste.
-
Add 100 µL M-PER reagent to each well and place plate on a shaking platform (100 rpm for 10 minutes).
-
Agitate the liquid in each well by pipetting up and down, and transfer to 0.5 mL microcentrifuge tube.
-
Centrifuge samples at 14,000 × g for 5 minutes to remove cell debris.
-
Transfer supernatants to clean tubes and store at −80 °C.
4.5.3. Example data
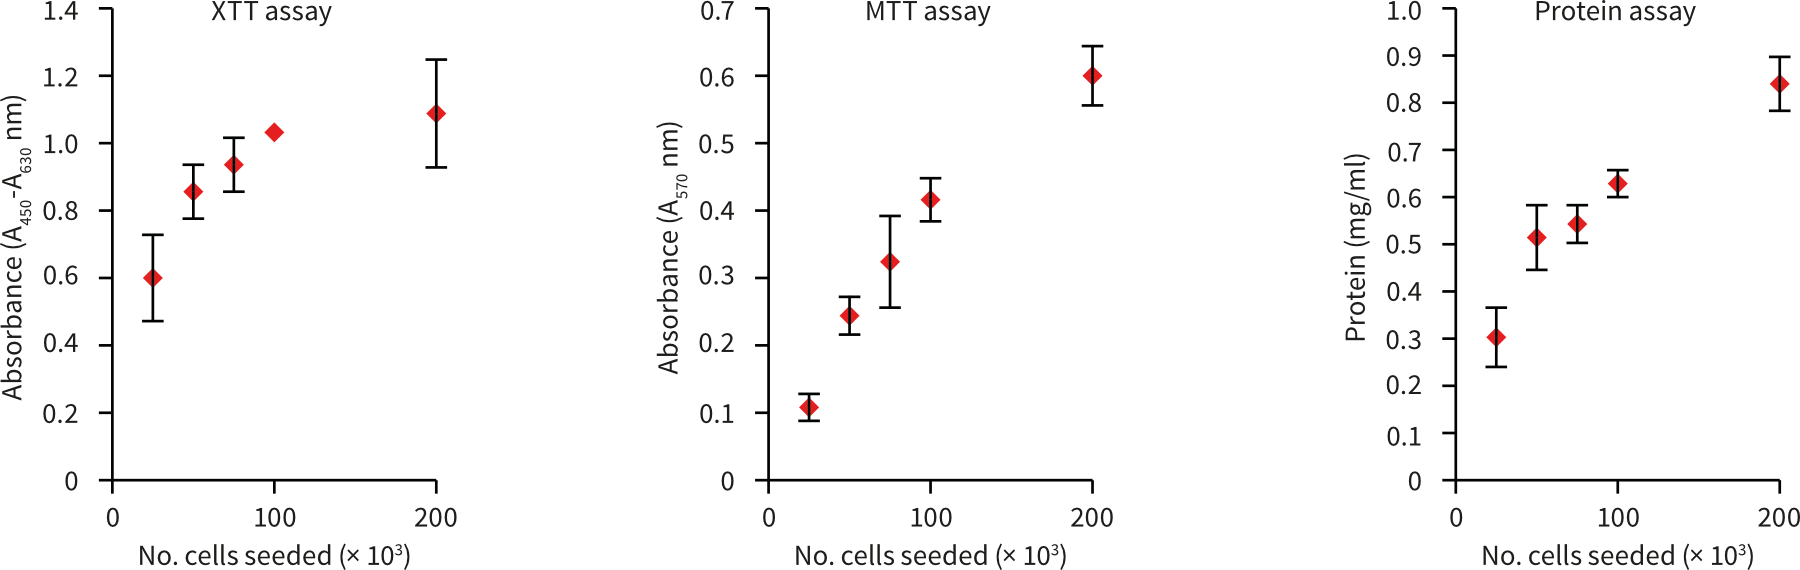
MDA-MB-231 breast carcinoma cells (ATCC, HTB-26) were routinely maintained inT-75 flasks. MDA-MB-231 culture media consisted of: Leibovitz’s L-15 medium (ATCC, 30-2008) supplemented with 10 % v/v FBS and 100 U/mL Penicillin/Streptomycin. Cells were seeded into Alvetex Scaffold 96 well plates (AVP009) at seeding densities ranging from 25 × 103 to 200 × 103 cells in a total media volume of 200 µL per well. Plates were incubated for 24 hours at 37 °C with 0 % CO2, after which cultures were processed according to the protocol above.
A
B
C
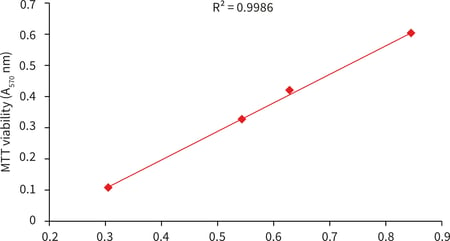
| Number of cells seeded per well | Protein yield per 3D culture (µg/mL) |
|---|---|
| 25,000 | 30.5 |
| 50,000 | 51.4 |
| 75,000 | 54.3 |
| 100,000 | 62.8 |
Figure 7. Protein extraction from Alvetex Scaffold 96 well plate. MDA-MB-231 cells were seeded into Alvetex Scaffold 96 well plates at densities of 25, 50, 75, 100, and 200 × 103 cells in 200 µl per well. Cell viability was measured using two methods (XTT and MTT assays) for comparison with protein concentrations in extracts obtained via the protocol above (A) (n = 3, mean ± SD). Pairwise plot of MTT viability and protein concentration (B) reveals a linear relationship between cell number and protein yield (R2 = 0.9986). Protein yields ranged from approximately 30 µg/well for 25 × 103 cells seeded, to approximately 85 µg/well for 200 × 103 cells (C). Protein was estimated using the Protein Assay Reagent (Bio-Rad, 500-0006) and a BSA standard curve. For protocols for XTT and MTT viability assays in Alvetex Scaffold 96 well plates see Alvetex Protocols.
5. Growth optimisation protocols for different cell types on Alvetex Scaffold 96 well plate technology
All 96 well plates used for protocol optimisation were prepared for seeding as described in Section 3.1 prior to inoculation of the cells. All optimisation of cell growth was optimised using the MTT cell viability assay as described in Section 4.1.
5.1. HepG2 (hepatocarcinoma)
HepG2 (hepatocellular carcinoma) cell line is one of the most widely used for evaluating the toxicity of chemicals and drugs[1]. HepG2 cells are conventionally cultured as a monolayer in a two-dimensional (2D) plate, but when grown in monolayer culture they express lower levels of the cytochrome P450 (CYP) enzymes, compared to primary human hepatocytes[2].
5.1.1. Method
-
HepG2 cells were routinely maintained in T75 culture flasks.
-
Complete growth media consisted of: MEM (Invitrogen, 21090-022) supplemented with 10 % v/v FBS, 2 mM L-glutamine and 100 U/mL Penicillin/Streptomycin.
-
Cells were harvested by trypsinisation and centrifuged for 5 minutes (1200 rpm). The supernatant was discarded and the cell pellet was re-suspended in an appropriate volume of media for cell counting by trypan blue.
-
Cells were re-suspended and seeded as described in Section 3.2.
-
The plate was placed directly into the incubator at 37 °C with 5 % CO2.
-
Plates were maintained by complete media exchange after every 1-2 days.
5.1.2. Example data set
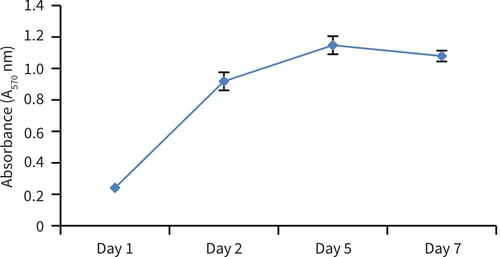
Figure 8. Cell viability growth curve (MTT assay). HepG2 cells were seeded at a density of 100,000 cells per well onto Alvetex Scaffold 96 well plate format and subsequently monitored over a 7 day period. Cell growth proceeded through an initial log phase and then reached a plateau by day 5, after which time the viability began to decline; n = 3, ± SEM.
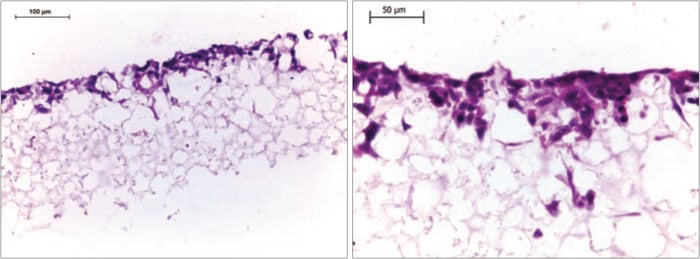
Figure 9. Histological analysis of HepG2 (60,000 per well) cells after growing for 7 days on Alvetex Scaffold 96 well plate format. The cells occupy the top section of the scaffold and retain a 3D morphology. Cells were fixed, embedded in paraffin wax, sectioned (10 µm) and counterstained with haematoxylin and eosin. (Scale bars: 100 µm (left) and 50 µm (right).
5.1.3. References
-
Knasmuller S, Mersch-Sundermann V, Kevekordes S, Darroudi F, Huber WW, Hoelzl C, Bichler J, and Majer BJ: Use of human-derived liver cell lines for the detection of environmental and dietary genotoxicants; current state of knowledge. Toxicology, 198, 315-328 (2004).
-
Wilkening S, Stahl F, and Bader A: Comparison of primary human hepatocytes and hepatoma cell line HepG2 with regard to their biotransformation properties. Drug Metab Dispos, 31, 1035-1042 (2003).
5.2. HaCaT (immortalised human keratinocytes)
HaCaT, a spontaneously immortalised cell line, exhibits some stratification in organotypic co- cultures, but generally lack the criteria of a typical ordered structure and regular keratinisation[1,2]. However, other reports in the literature show that the HaCaT cell line expresses a high degree of differentiation under organotypic conditions[3], declaring the cell line: “as an appropriate model for elucidation of the molecular mechanisms regulating keratinocyte growth and differentiation and for use in toxipharmacology.”
5.2.1. Method
-
HaCaT cells were routinely maintained in T75 culture flasks.
-
Complete growth media consisted of: DMEM (Lonza, BE12-614F), supplemented with 10 % v/v FBS, 2 mM L-glutamine and 100 U/mL Penicillin/Streptomycin.
-
Cells were harvested by trypsinisation and centrifuged for 5 minutes (1200 rpm). The supernatant was discarded and the cell pellet was re-suspended in an appropriate volume of media for cell counting by trypan blue.
-
Cells were re-suspended and seeded as described in Section 3.2.
-
The plate was placed directly into the incubator at 37 °C with 5 % CO2.
-
Plates were maintained by complete media exchange after every 1-2 days.
5.2.2. Example data
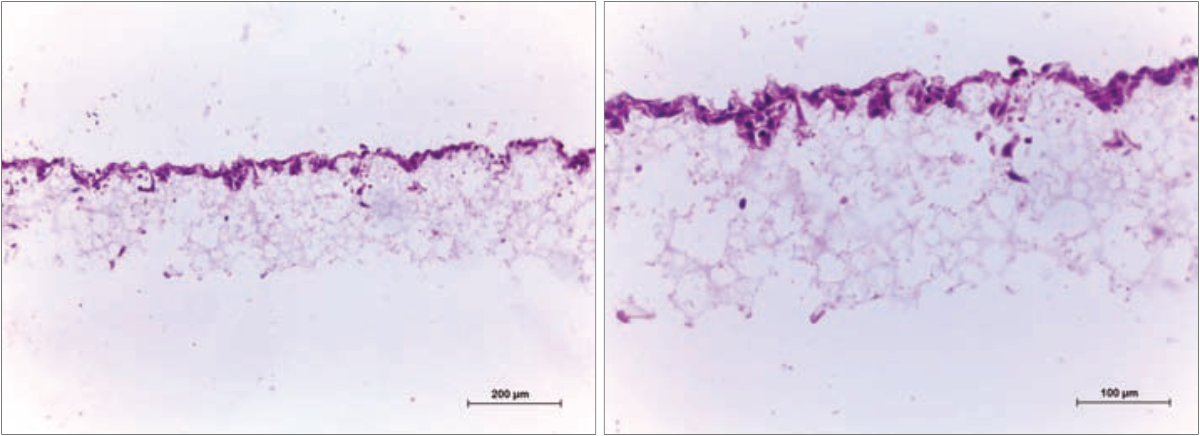
Figure 10. Histology analysis of HaCaT (180,000 per well) cells after growing for 1 day on Alvetex Scaffold 96 well plate format. The cells occupy the top section of the scaffold and retain a 3D morphology. Cells were fixed, embedded in paraffin wax, sectioned (10 µm) and counterstained with haematoxylin and eosin. (Scale bars: 200 µm (left) and 100 µm (right).
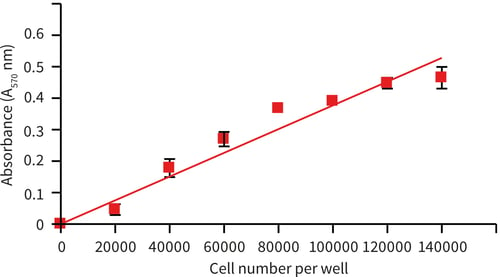
Figure 11. MTT standard curve for HaCaT cells (0-140,000 cell number) after 24 hours incubation. n=3,±SEM.
5.2.3. References
-
Boelsma E, Verhoeven MCH and Ponec M (1999). Reconstruction of a human skin equivalent using a spontaneously transformed keratinocyte cell line (HaCaT). Journal of Investigative Dermatology 112, 489-498.
-
Maas-Szabowski N, Starker A and Fusenig NE (2003). Epidermal tissue regeneration and stromal interaction in HaCaT cells is initiated by TGF-alpha. Journal of Cell Science 116, 2937- 2948.
-
Schoop VM, Mirancea N and Fusenig NE (1999). Epidermal organization and differentiation of HaCaT keratinocytes in organotypic co-culture with human dermal fibroblasts. Journal of Investigative Dermatology 112, 343-353.
5.3. LN-229 (glioblastoma)
The LN-229 cell line was established in 1979 from cells taken from a patient with right frontal parietooccipital glioblastoma[1]. The cell line is mainly used in studies of apoptosis. Stimulation of the cells with Fas ligand leads to apoptotic cell death within 16 hours. The cells are also killed by puromycin in a dosedependent manner[2].
5.3.1. Method
-
LN-229 cells were routinely maintained in T75 culture flasks.
-
Complete media consisted of: DMEM (Lonza, BE12-614F) supplemented with 5 % v/v FBS, 2 mM L-glutamine and 100 U/mL Penicillin/Streptomycin.
-
Cells were harvested by trypsinisation and centrifuged for 5 minutes (1200 rpm). The supernatant was discarded and the cell pellet was re-suspended in an appropriate volume of media for cell counting by trypan blue.
-
Cells were re-suspended and seeded as described in Section 3.2.
-
The plate was placed directly into the incubator at 37 °C with 10 % CO2.
-
Plates were maintained by complete media exchange after every 2 days.
5.3.2. Example data set
LN-229 cells were maintained on Alvetex Scaffold 96 well plates for up to 10 days. Cultures underwent complete media change every 2 days. Cultures were harvested and analysed by histological staining after 7 days, 100000 cells/well and MTT viability assay at 1, 3, 7 and 10 days, to monitor cell survival and proliferation within the scaffold.
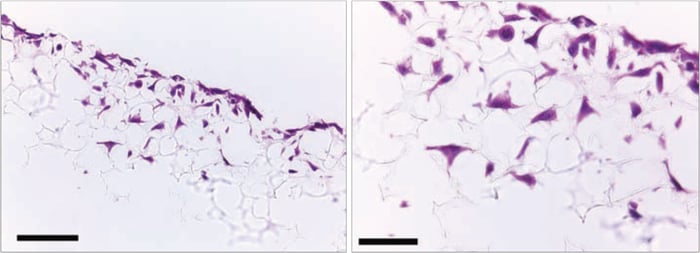
Figure 12. Histological analysis of LN-229 cells after growing for 3 days on Alvetex Scaffold 96 well plate format. LN-229 cells penetrate and grow within the Alvetex Scaffold structure. Cells were fixed, embedded in paraffin wax, sectioned (10 µm) and counterstained with haematoxylin and eosin. Scale bars: 100 µm (left) and 50 µm (right).
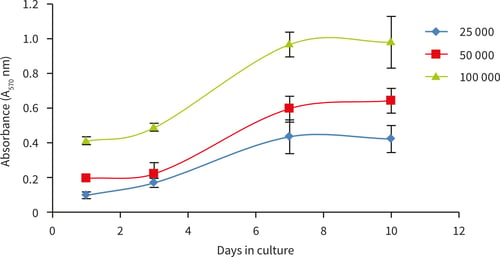
Figure 13. Growth curves performed by MTT viability analysis for up to 10 days at three different cell seeding densities. Good linear growth observed between 3 and 7 days with plateau of cell growth observed at 10 days for all seeding densities; n = 6, ± SD.
5.3.3. References
-
Ishii N, et al. Frequent co-alterations of TP53, p16/CDKN2A, p14ARF, PTEN tumor suppressor genes in human glioma cell lines. Brain Pathol. 9: 469-479, 1999.
-
Schlapbach R, Fontana A. Differential activity of bcl-2 and ICE enzyme family protease inhibitors on Fas and puromycin-induced apoptosis of glioma cells. Biochem Biophys Acta 1359: 174-180, 1997.
5.4. SW620 (colorectal adenocarcinoma)
SW620 cells are an established and widely recognised example of colon carcinoma cells frequently used in research. This lineage along with the SW480 cell line was originally isolated in the mid 1970s from the same patient representing different stages of disease progression[1]. SW480 cells originated from the primary colon adenocarcinoma, whereas the SW620 lineage was isolated from a lymph node metastasis. Although related, these cell lines differ in terms of their morphology, surface markers[2] and behaviour in vivo[3, 4]. These characteristics make these cells an ideal subset to study cellular changes from early to late stages during cancer progression. This protocol describes the growth of the later stage SW620 colon cancer cell line on Alvetex Scaffold 96 well plate.
5.4.1. Method
-
SW620 cells were routinely maintained in T75 flasks.
-
Complete growth media consisted of: DMEM (Lonza, BE12-614F) High glucose supplemented with 10 % v/v heat inactivated FBS, 2 mM L-glutamine and 100 U/mL Penicillin/Streptomycin.
-
Cells were harvested by trypsinisation and centrifuged for 5 minutes (1200 rpm). The supernatant was discarded and the cell pellet was re-suspended in an appropriate volume of media for cell counting by trypan blue.
-
Cells were re-suspended and seeded as described in Section 3.2.
-
The plate was placed directly into the incubator at 37 °C with 5 % CO2.
-
Plates were maintained by complete media exchange after every 1-2 days.
5.4.2. Example data set
SW620 cells were maintained on Alvetex Scaffold 96 well plates for up to 10 days. Cultures underwent complete media change every 2 days. At specific time points, cultures were analysed by histological staining at 7 days and MTT viability assay at 1, 3, 7 and 10 days to monitor cell survival and proliferation within the scaffold.
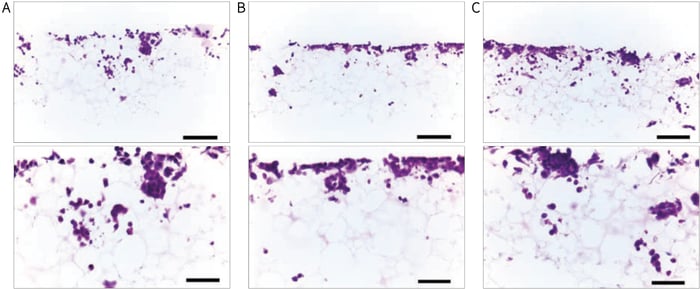
Figure 14. Histological analysis of SW620 cells after growing for 7 days on Alvetex Scaffold 96 well plate format. SW620 cells penetrate and grow within the Alvetex Scaffold structure. (A) 25,000 cells/well, (B) 50,000 cells/well and (C) 100,000 cells/well. Cells were fixed, embedded in paraffin wax, sectioned (10 µm) and counterstained with haematoxylin and eosin. (Scale bars: 100 µm (top) and 50 µm (bottom).
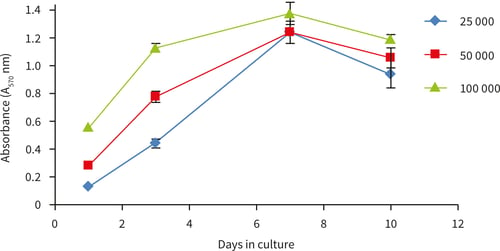
Figure 15. Growth curves ascertained by MTT viability analysis for up to 10 days at three different cell seeding densities. Good linear growth was observed between 1 and 7 days with a decrease in viability observed at 10 days for all seeding densites, n=4, ± SD.
5.4.3. References
-
Leibovitz A et al. 1976. Classification of human colorectal adenocarcinoma cell lines. Cancer Res 36: 4562-9.
-
Schneider M et al. 2012. Characterisation of colon cancer cells: a functional approach characterising CD133 as a potential stem cell marker. BMC Cancer 12: 96-106.
-
Subauste M-C et al. 2009. Evaluation of metastatic and angiogenic potentials of human colon carcinoma cells in chick embryo model systems. Clin Exp Metastasis 26(8): 1033-47.
-
Witty J-P et al. 1994. Modulation of matrilysin levels in colon carcinoma cell lines affects tumorigenicity in vivo. Cancer Res 54: 4805-12.
5.5. MCF-7 (breast adenocarcinoma)
The MCF-7 cell line was isolated in 1970 from a 70 year old caucasion woman. MCF-7 breast cancer cells have been studied extensively as a model for hormonal effects on breast cancer cell growth and protein synthesis[1]. The MCF-7 line retains several characteristics of differentiated mammary epithelium including ability to process estradiol via cytoplasmic estrogen receptors and the capability of forming domes. The cells express the WNT7B oncogene[2].
5.5.1. Method
-
MCF-7 cells (ATCC, CRL-2611) were routinely maintained in T-75 flasks.
-
Complete media consisted of: MEM (Invitrogen, 21090-022) supplemented with 10 % v/v FBS, 2 mM L-glutamine, 1 mM sodium pyruvate and 100 U/mL Penicillin/Streptomycin.
-
Cells were harvested by trypsinisation and centrifuged for 5 minutes (1200 rpm). The supernatant was discarded and the cell pellet was re-suspended in an appropriate volume of media for cell counting by trypan blue.
-
Cells were re-suspended and seeded as described in Section 3.2.
-
The plate was placed directly into the incubator at 37 °C with 5 % CO2.
-
Plates were maintained by complete media exchange after every 2 days.
5.5.2. Example data set
MCF-7 cells were maintained on Alvetex Scaffold 96 well plates for up to 10 days. Cultures underwent complete media change every 2 days. At specific time points, cultures were harvested and analysed by histological staining at 3 days and MTT viability assay at (1, 3, 7 and 10 days) to monitor cell survival and proliferation within the scaffold.
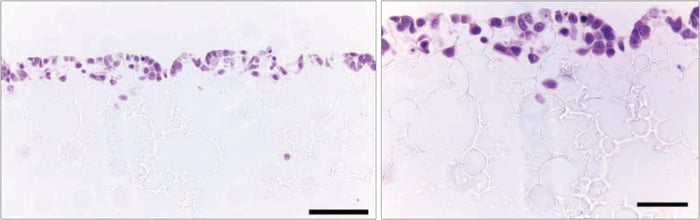
Figure 16. Histological analysis of ~30,000 MCF-7 cells after culture for 3 days on Alvetex Scaffold 96 well plate format. MCF-7 cells grow on the top third of the scaffold and three-dimensional cell growth is maintained. (Scale bars: 100 µm (left) and 50 µm (right).)
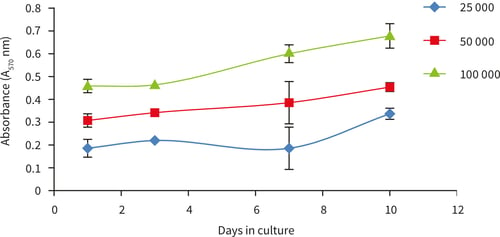
Figure 17. Growth curves performed by MTT viability analysis for up to 10 days at three different cell seeding densities (25,000, 50,000 and 100,000 cells/well), n = 4, ± SD.
5.5.3. References
-
Soule HD, Vazquez J, Long A, Albert S, Brennan M (1973). A human cell line from a pleural effusion derived from a breast carcinoma. Journal of the National Cancer Institute 51 (5): 1409- 1416.
-
Huguet EL, et al. Differential expression of human Wnt genes 2, 3, 4, and 7B in human breast cell lines and normal and disease states of human breast tissue. Cancer Res 54: 2615-2621, 1994.
5.6. PC-3 (prostate adenocarcinoma)
The PC-3 cell line is one of the main cell lines used in Prostate cancer research. PC-3 cells have a high metastatic potential compared to other prostate cancer cell lines such as LNCaP and DU 145. This cell line was established in 1979 from a bone metastasis site of a 62 year old Caucasian male[1]. PC-3 cells are reported to be androgen receptor negative. However there are contradicting reports suggesting that PC-3 cells express AR mRNA[2]. They are also known not to express Prostate-Specific Antigen and are PSMA (Prostate-Specific Membrane Antigen) negative.
5.6.1. Method
-
PC-3 cells were routinely maintained in T-225 flasks.
-
Complete media consisted of: Either ATCC formulated F12-K medium (Kaighn’s modification)
supplemented with 10 % v/v FBS and 100 U/mL Penicillin/Streptomycin or F12-K medium (Kaighn’s modification) (Invitrogen, 21127-022) supplemented with 10 % v/v FBS and 100 U/mL Penicillin/ Streptomycin.
-
Cells were harvested by trypsinisation and centrifuged for 5 minutes (1200 rpm). The supernatant was discarded and the cell pellet was re-suspended in an appropriate volume of media for cell counting by trypan blue.
-
Cells were re-suspended and seeded as described in Section 3.2.
-
The plates were placed directly into the incubator at 37 °C with 5 % CO2.
-
Medium changes were performed every 2 days.
5.6.2. Example data set
PC-3 cells were maintained on Alvetex Scaffold 96 well plate format for up to 10 days. Cultures underwent complete media change every 2 days. At specific time points, cultures were harvested and analysed by histological staining at 3 days and MTT viability assay at (1, 2, 7 and 10 days) to monitor cell survival and proliferation within the scaffold.
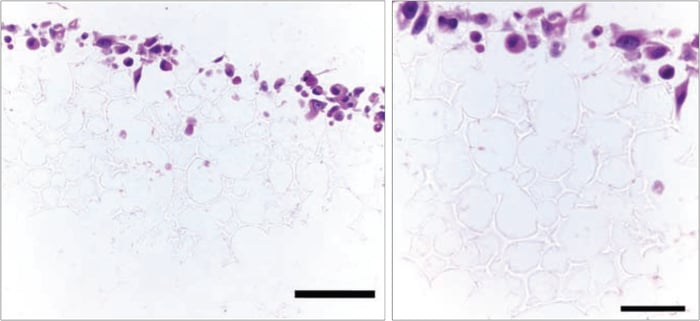
Figure 18. Histological analysis of ~30,000 PC-3 cells grown in Alvetex Scaffold 96 well plate format for 3 days. Cells grow in 3D within the top third of the scaffold. Scale bars: 100 µm (left) and 50 µm (right).
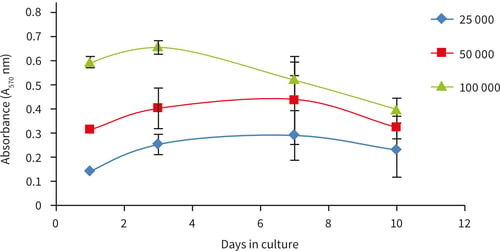
Figure 19. Growth curves obtained for the growth of PC-3 cells for up to 10 days in Alvetex Scaffold 96 well plate format. PC-3 cells show a plateauing of cell growth around 3-7 days at cell seeding density of 25,000 and 50,000 cells/well. At 100,000 cells/well the cell growth reaches confluency and decreases up to 10 days in culture, n = 6, ± SEM.

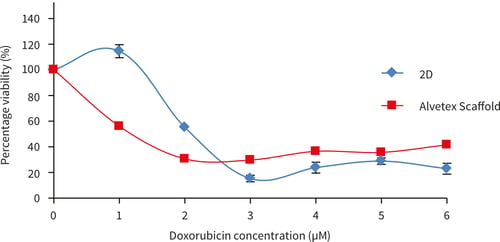
Figure 20. SW620 cells after 72 hours culture period and exposure doxorubicin for 72 hours. Data represents n=6, ± SE (IC50 values, 1.5 µM for 2D, for Alvetex Scaffold cell viability remains above 50 %).
5.6.3. References
-
Kaighn ME, et al. Establishment and characterization of a human prostatic carcinoma cell line (PC-3). Invest Urol 17: 16-23, 1979.
-
Chlenski A, Nakashiro K, Ketels KV, Korovaitseva GI and Oyasu R. (2001) Androgen receptor expression in androgen independent prostate cancer cell lines. Prostate 47, 66-75.
6. Example application 1: Assessment of MCF-7 and SW620 cytotoxicity to known cancer compounds in 2D conventional plates and 3D culture using Alvetex Scaffold 96 well plate technology
Certain aspects of cancer research rely on animal models but these have associated feasibility and ethical concerns[1,2]. Another widely used in vitro system is the clonogenic assay[3] which has been widely used to determine drug response of tumours. However, such issues as low frequency of evaluation, clump artefacts, lack of cytotoxic end points and lack of normal cell-cell interactions (which exist in a normal tissue environment), provide a need for the development of more realistic three-dimensional (3D) in vitro culture systems that can more accurately predict in vivo resistance and allow a controlled approach to investigating cancer cell biology, compound screening and disease modelling. The vast majority of such models involve culturing cells on conventional two-dimensional (2D) plastic-ware in which cells adapt to the flat polystyrene substrate, flatten and grow as monolayers. Unfortunately, this approach is a poor surrogate and does not mimic the environment that cells experience in vivo. The morphology of cultured cells as monolayers is not realistic, cell-to-cell contact is limited and the microenvironment generated by the cells, for example via extracellular matrix (ECM) deposition, is reduced and altered[4].
In this application using Alvetex Scaffold 96 well plate technology, we demonstrate the 3D growth of the popular breast cancer cell line, MCF-7 and the colon cancer cell line SW620. We compare the viability of these cells with equivalent cultures grown on conventional 2D plastic-ware. The data show that MCF-7 and SW620 cells cultured on Alvetex Scaffold 96 well plate possess a different sensitivity pattern to certain cytotoxic drugs than their 2D counterparts that is more likely to resemble in vivo responses. This underlines the value of Alvetex Scaffold technology by providing a superior culture environment for cancer cell research and providing a tool to enhance in vitro sensitivity assays in cancer.
6.1. Method
MCF-7 cells (ATCC) were cultured at 50,000 cells/well for a period of 3 days prior to exposure to doxorubicin (1-10 µM) and tamoxifen (10-50 µM) for a period of 72 hours. SW620 cells were cultured at 50,000 cells/well for a period of 3 days prior to exposure to doxorubicin (1-10 µM) for 72 hours. Cell viability was assessed using the MTT assay (see Section 4.1) and the percentage viability calculated against a non drug treated control (designated 100 % viability).
Tamoxifen, a commonly used drug in hormone receptor-positive breast cancer, is an antagonist of the estrogen receptor in breast tissue by the common metabolite hydroxytamoxifen. Doxorubicin, another commonly used drug in cancer chemotherapy is an anthracycline antibiotic and works by intercalating DNA.
A
 B
B
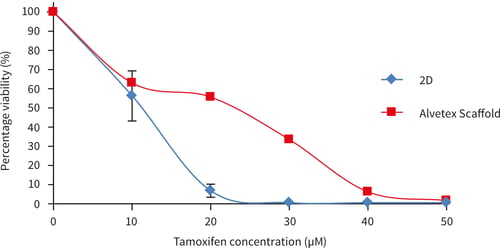
Figure 21. MCF-7 cells after 72 hours culture period and exposure to the following drugs for 72 hours (A) doxorubicin (B) tamoxifen. Data represents n=6, ± SEM. IC50 values (A) 2.1 µm and 1.1 µM for 2D and Alvetex Scaffold, respectively, (B) 11.7 µM and 23.9 µM for 2D and Alvetex Scaffold, respectively.
MCF-7 cells show a different response to exposure to doxorubicin compared to tamoxifen. When exposed to doxorubicin, a more sensitive initial response was observed at 1 and 2 µM concentration with MCF-7 cells in Alvetex Scaffold, but with a greater percentage of viable cells at further increasing concentrations compared to MCF-7 cells cultured in 2D plates. 100 % cell death was not achieved in either MCF-7 cells grown in 2D or Alvetex Scaffold format at the concentrations tested. After 3 days tamoxifen exposure, MCF- 7 cells grown on Alvetex Scaffold 96 well plate format show greater resistance at all tamoxifen concentrations. 100 % cell death was achieved at an approximate concentration of 23.9 µM with MCF- 7 cells grown in 2D compared to Alvetex Scaffold 96 well plate format where 100 % cell death was not achieved at the maximum concentration of tamoxifen used (50 µM).
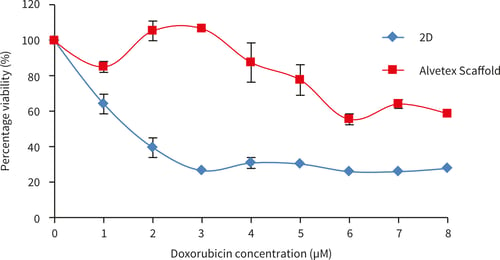
Figure 22. SW620 cells after 72 hours culture period and exposure doxorubicin for 72 hours. Data represents n = 6, ± SE (IC50 values, 1.5 µM for 2D, for Alvetex Scaffold cell viability remains above 50 %).
When exposed to doxorubicin SW620 cells show far greater resistance to all concentrations of doxorubicin tested compared to SW620 cells grown in 2D culture.
6.2. Conclusions
Overall, Alvetex Scaffold 96 well plate technology provides a unique platform which is compatible with standard in vitro assay methods used when culturing tumour cells to assess and screen a large range of test compounds. However the sensitivity patterns obtained on Alvetex Scaffold 96 well plate technology are different to standard 2D assay responses, showing this three-dimensional technology could provide a more sensitive and accurate tool for the use of in vitro sensitivity assays in cancer research and drug development.
6.3. References
-
Strebhardt K and Ullrich A. Paul Ehrlich’s magic bullet concept: 100 years of progress. Nat Rev Cancer 2008. 8(6): p. 473-80.
-
Lord CJ and Ashworth A. Biology-driven cancer drug development: back to the future. BMC Biol, 2010. 8: p. 38.
-
Hoffman RM. In vitro sensitivity assays in cancer: A review, analysis and prognosis. J Clin Lab Anal 1991. 5: p. 133-143.
-
Knight A. Systematic reviews of animal experiments demonstrate poor human clinical and toxicological utility. Altern Lab Anim 2007. 35(6): p. 641-59.
7. Example application 2: Paracetamol response of HepG2 cells on Alvetex Scaffold 96 well plate technology
Drug metabolism is a process in which drugs are chemically altered by cells to more water soluble metabolites to allow elimination in urine or bile or by increasing access to drug excretory transporters[1]. A feature of hepatic metabolism pathways is the never ending array of drug substrates that are succesfully metabolised by the liver. The liver is perfectly designed as a drug removal organ. Most xenobiotics enter the body by absorption through the gastrointestinal tract and then venous drainage via the portal vein to the liver. Along with the combination of drug- metabolising enzymes and drug transporters present in the intestinal mucosa, the liver provides an efficient barrier that prevents xenobiotics entering the body’s circulation.
Phase 1 metabolism is the basic structural alteration of the drug molecule. Phase 2 metabolism involves conjugation of water soluble moieties attached to the drug, which plays a role in detoxification and facilitates excretion. P450 enzymes are the major catalysts of phase 1 metabolism in the liver. A subset of the P450 enzyme family, CYP1, 2 and 3 gene families account for 70-80 % of all phase 1 dependent metabolism of therapeutic drugs. Phase 2 metabolism involves transferases which catalyse the transfer of the hydrophilic group to the drug. One of the important functions of phase 2 enzymes is the detoxification of reactive metabolites from phase 1 drug metabolism.
Drug metabolism usually produces metabolites with lower pharmacological activity and toxicity than the parent drug, but this is not always the case as shown by examples such as irinotecan, a drug used for chemotherapy of colorectal cancer. Here metabolic activation by CYP3A4 results in a compound known as SN-38 which is the active pharmacological agent. The SN-38 is subsequently detoxified in phase 2 metabolism by conjugation with α-glucoronic acid.
Drug metabolism is also a factor in dose response related hepatotoxicity. Paracetamol (acetaminophen, APAP) is a well known example of dose related toxicity. P450 mediated phase 1 metabolism of paracetamol gives rise to the reactive intermediate N-acetyl-p-benzoquinone (NAPQI), which is detoxified by phase 2 conjugation with hepatic glutathione. In the event of paracetamol overdose the formation of NAPQI exhausts the glutathione stores and hepatic toxicity proceeds.
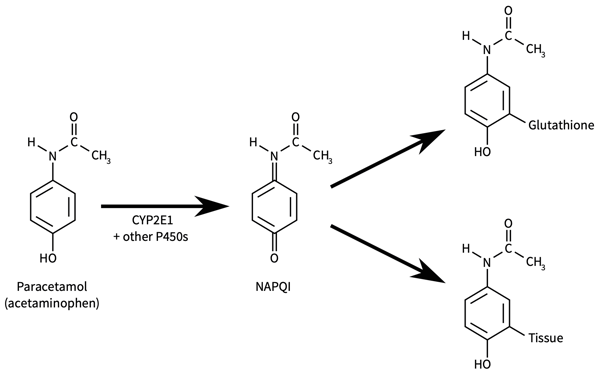
Figure 23. Metabolic activation of paracetamol (acetaminophen) to a hepatotoxic metabolite[1].
This application note describes the dose response of the HepG2 cell line to increasing concentrations of paracetamol screened on Alvetex Scaffold 96 well plate technology. The HepG2 cell line is one of the most widely used for evaluating the toxicity of chemicals and drugs[2]. HepG2 cells are conventionally cultured as a monolayer in a two-dimensional (2D) plate, but when grown in monolayer culture they express lower levels of the cytochrome P450 (CYP) enzymes, compared to primary human hepatocytes[3].
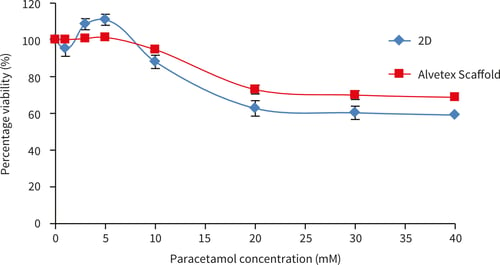
7.1. Method
HepG2 cells (100,000 cells/well) were cultured for up to 48 hours before exposure to paracetamol dissolved in culture medium (Acetaminophen, Sigma A7085) for up to 48 hours (1-50 mM). Viability was assessed using the MTT assay (see Section 4.1) and percentage viability was determined by comparing to a non paracetamol treated control (designated 100 % viability).
A
 B
B
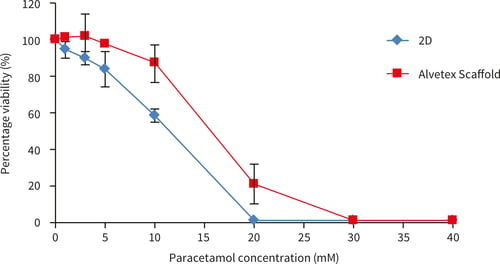
Figure 24. Paracetamol dose response of HepG2 cells on Alvetex Scaffold 96 well plate technology, (A) 24 hours cell growth and 24 hours paracetamol exposure (n = 3, ±SEM) and (B) 48 hours cell growth and 48 hours paracetamol exposure (n = 2, ± SEM). Response A shows a similar pattern as published previously by Schutte et al[4].
HepG2 cells showed a cytotoxic response to increasing dose concentrations of paracetamol. The responses differed between 3D and 2D cultures. In both Alvetex and 2D, an initial cytotoxic response was observed at between 10-20 mM paracetamol. After 24 hours exposure a higher percentage of HepG2 cells survive on Alvetex Scaffold above 10 mM concentration of paracetamol. After 48 hours paracetamol exposure, good dose response curves are observed on both 2D and Alvetex Scaffold plates with a higher resistance/cell survival observed at all paracetamol concentrations on Alvetex Scaffold leading to a higher IC50 value obtained on Alvetex Scaffold compared with 2D cultures (15.7 mM, and 11.9 mM respectively). 100 % cell death was observed at 20 mM and 30 mM paracetamol for 2D and Alvetex Scaffold format respectively.
7.2. Conclusions
Alvetex Scaffold 96 well plate technology is a valuable tool for in vitro toxicological and pharmacological studies on HepG2 cells. This initial study using the HepG2 cell line is a useful guide for primary hepatocyte growth and toxicological studies on Alvetex Scaffold 96 well plate technology.
7.3. References
-
The Textbook of Hepatology: From Basic Science to Clinical Practice, Section 2 Function of the Liver. 3rd edition, 2007.
-
Knasmuller S, Mersch-Sundermann V, Kevekordes S, Darroudi F, Huber WW, Hoelzl C, Bichler J, and Majer BJ. Use of human-derived liver cell lines for the detection of environmental and dietary genotoxicants; current state of knowledge. Toxicology 198, 315-328 (2004).
-
Wilkening S, Stahl F, and Bader A. Comparison of primary human hepatocytes and hepatoma cell line HepG2 with regard to their biotransformation properties. Drug Metab Dispos 31, 1035- 1042 (2003).
-
Schutte S, Fox B, Baradez M, Devonshire A, Minguez J, Bokhari M, Przyborski S, and Marshall D. Rat primary hepatocytes show enhanced performance and sensitivity to acetaminophen during three-dimensional culture on a polystyrene scaffold designed for routine use. Assay Drug Dev Techn 9, 475-486 (2011).
8. Troubleshooting guide, hints and tips
8.1. Edge effects
Edge effects are widely recognised as factors that contribute to the deterioration of assay performance in high throughput screening (HTS)[1]. Several reports on edge effects in microplate- based adsorption assays claim this to be due to thermal gradients and different adsorption characteristics across the multiwell plates[2, 3]. It is common for some screening departments to avoid using the peripheral wells of the plate. In the report by Lundholt and colleagues[1], they suggest allowing newly seeded plates to incubate at room temperature for 1 hour prior to placing in the CO2 incubator. This allows for more even cell distribution within the wells by minimising thermal gradients across the plate. Instant placement of the plate in the incubator can lead to uneven cell distribution in peripheral wells, resulting in increased edge effects. When using Alvetex Scaffold 96 well plates we suggest avoiding use of peripheral wells of the plate, when feasible, or running the blank controls in the edge wells to avoid well-to-well variability of test samples.
8.1.1. References
-
Lundholt BK, Scudder KM and Pagliaro L: A Simple Technique for Reducing Edge Effect in Cell-Based Assays. J Biomol Screen 2003 8: 566.
-
Burt SM, Carter TJ, Kricka LJ: Thermal characteristics of microtitre plates used in immunological assays. J Immunol Methods 1979; 31:231-236.
-
Oliver DG, Sanders AH, Hogg RD, Hellman JW: Thermal gradients in microtitration plates. Effects on enzyme-linked immunoassay. J Immunol Methods 1981; 42:195-201.
8.2. Removal of plates during culture
The continual removal of the 96 well plates during culture for medium changes etc., can lead to differential temperature and adjustment rates across the plate. The optimum frequency of media changes may well depend on the cell type and cell number per well. Ideally, media changes should occur every other day. If any well-to-well variability is observed after performing the assay, either shorter term cultures or less frequent media changes are recommended to avoid temperature variability across the plate.
8.3. Assay troubleshooting
When using a two step assay such as the MTT assay, solubilisation of the metabolic product is a critical step. The MTT assay can be reproducibly performed for measuring viability and cytotoxic response in cells in Alvetex Scaffold 96 well plates. When performing the MTT assay, care should be taken to ensure full solubilisation of the product. This can be achieved by either incubating the plate at 37 °C for 5-10 minutes, to aid the solubilisation of the formazan product, or if further solubilisation is required, place in the fridge with mixing of the wells periodically with a pipette. This will help avoid evaporation of the acidified alcohol. Phenol red free media is used due to the phenol red interference with formazan measurement. Ideally one step assays where the product is released into the culture medium are recommended e.g. MTS, XTT and alamarBlue™.
8.4. Plate stacking
As mentioned above, differential temperatures can affect assay performance across the cell culture plate. This is particularly the case where enzymatic activity is being measured. It is always crucial to run the assays at a uniform temperature. Stacking of plates should be avoided to ensure complete temperature equilibration, unless the temperature of the plates across the stack can be kept uniform.
8.5. Which techniques are compatible with Alvetex Scaffold 96 well plate technology?
The following techniques are compatible with Alvetex Scaffold 96 well plate technology:
-
Colourimetric cell viability assays (MTT, MTS) (product must be removed and absorbance measured in a fresh 2D 96 well plate on an appropriate plate reader).
-
Fluorescent and luminescent based assay kits (e.g. CellTiter-Glo®, Promega).
-
Liquid handling robotics platforms.
-
In situ reading with fluorescent and luminescent plate readers (only for microplate readers which read from the top of the well).
8.6. Which techniques are not compatible with Alvetex Scaffold 96 well plate technology?
The following techniques are not compatible with Alvetex Scaffold 96 well plate technology:
-
Standard histology (although histological images are presented within this document, it is not feasible to routinely remove the Alvetex Scaffold from the well plates).
-
Immunohistochemical techniques.
-
Scanning and transmission electron microscopy (SEM and TEM)
-
Brightfield, phase contrast and fluorescent microscopy.
-
In situ absorbance reading (light does not easily pass through Alvetex Scaffold).
-
Complete removal of all cells for analysis (e.g. FACS analysis).