1. Introduction
The LN-229 cell line was established in 1979 from cells taken from a patient with right frontal parieto-occipital glioblastoma.[1] The cell line is mainly used in studies of apoptosis. Stimulation of the cells with Fas ligand leads to apoptotic cell death within 16 hours. The cells are also killed by puromycin in a dose dependent manner.[2]
2. Methods
2.1. Preparation for 3D cell culture on Alvetex Scaffold 96-well plate
1. LN-229 cells (ATCC, CRL-2611) were routinely maintained in T-75 flasks.
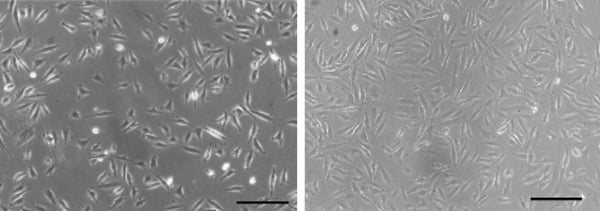
Figure 1. Phase contrast micrograph of LN-229 cells grown in conventional 2D culture plates.
Scale bar: 100 µm.
-
Complete media consisted of: DMEM supplemented with 5 % v/v FBS, 2 mM Lglutamine and 100 U/mL Penicillin/Streptomycin.
-
Cells were harvested by trypsinisation and centrifuged for 5 minutes (1200 rpm). The supernatant was discarded and the cell pellet was re-suspended in an appropriate volume of media for cell counting by Trypan Blue.
-
Cells were re-suspended at a concentration of 125,000, 250,000 and 500,000 cells/mL for seeding the appropriate cell numbers in 200 μL total medium volume.
-
Alvetex Scaffold 96 well plates were prepared for seeding by washing each well with 300 μL of 70 % ethanol, 300 μL of 1 × PBS and 300 μL of complete culture media.
-
200 μL of the cell suspensions were added to the appropriate wells of the Alvetex Scaffold 96-well plate, which was equivalent to 25,000, 50,000 and 100,000 cells per well.
-
The plate was placed directly into the incubator at 37 °C with 10 % CO2.
-
Plates were maintained by complete media exchange after every 2 days.
2.2. MTT assay method
-
Medium was aspirated from each well.
-
200 μL of PBS was carefully added to each well and then aspirated.
-
MTT reagent (Sigma, M5655) was dissolved at 1 mg/mL in Phenol Red-free DMEM and filter sterilised (0.2 μm filter).
-
200 μL MTT reagent was added to each well and incubated in the dark at 37 °C / 10 % CO2 for 1 hour.
-
The MTT reagent was aspirated and replaced with 200 μL acidified isopropanol (1 μL concentrated hydrochloric acid per 1 mL isopropanol). The solution in each well was agitated by pipetting up and down to ensure blue formazan product was fully solubilised.
-
100 μL of the reaction product was transferred to a standard 96 well plate.
-
Absorbances were read at 570 nm.
-
Plates were maintained by complete media exchange after every 2 days.
3. Example Data Set
LN-229 cells were maintained on Alvetex Scaffold 96-well plates (AVP009) for up to 10 days. Cultures underwent complete media change every 2 days. At specific time points, cultures were harvested and analysed by histological staining at 3 days (Figure 2) and MTT viability assay at 1, 3, 7 and 10 days (Figure 3), to monitor cell survival and proliferation within the scaffold. For histology protocols refer to Alvetex Protocols.
The results show good evidence of growth of LN-229 cells in the Alvetex Scaffold 96 well plate format. The cell population grows in a typical fashion and reaches a plateau after 7-10 days. The data also demonstrate the compatibility of Alvetex Scaffold with a standard viability assay.
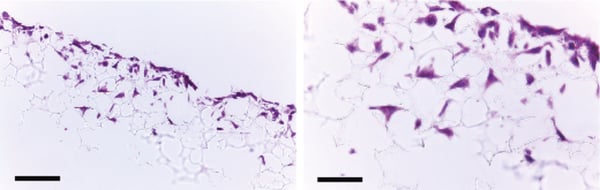
Figure 2. Histology analysis of LN-229 cells after growing for 3 days in Alvetex Scaffold 96 well plate format. LN-229 cells penetrate and grow within the Alvetex Scaffold structure. Cells were fixed, embedded in paraffin wax, sectioned (10 µm) and counterstained with Haematoxylin and Eosin. Scale bars: left, 100 µm; right, 50 µm.
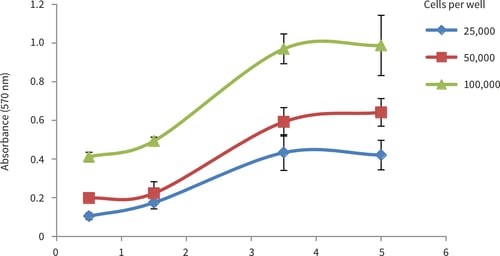
Figure 3. LN-229 growth curves obtained from MTT viability analysis for up to 10 days at three different cell seeding densities. Good linear growth was observed between 3 and 7 days, with a plateau in cell growth occurring after 7 days for all seeding densities (n = 6, mean ± SD).
4. References
- Ishii N, et al. Frequent co-alterations of TP53, p16/CDKN2A, p14ARF, PTEN tumor suppressor genes in human glioma cell lines. Brain Pathol 9:469-479, 1999.
- Schlapbach R, Fontana A. Differential activity of bcl-2 and ICE enzyme family protease inhibitors on Fas and puromycin-induced apoptosis of glioma cells. Biochim Biophys Acta 1359:174-180, 1997.