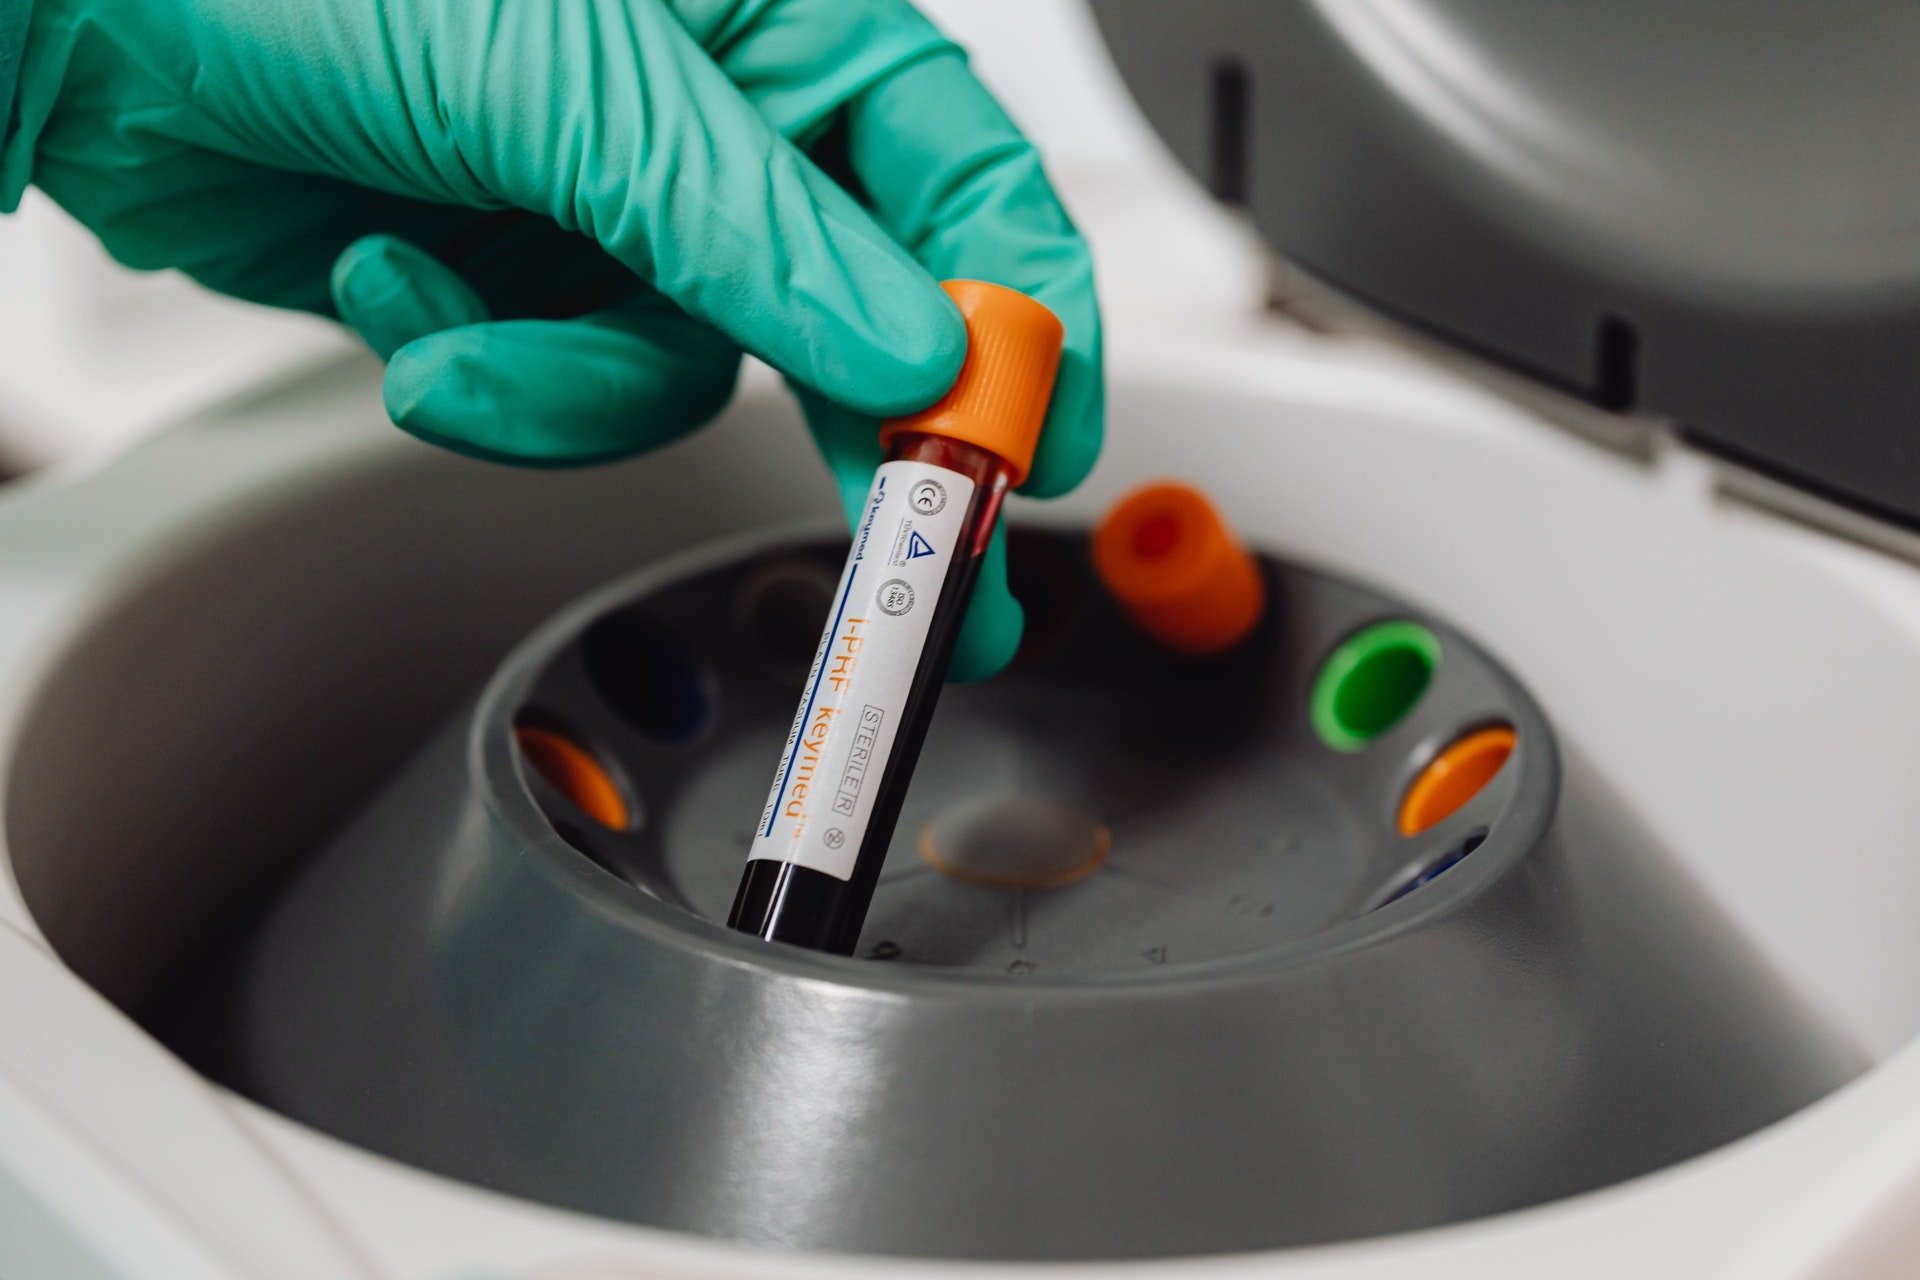
In the last two decades, precision medicine has become an integral part of drug development strategies. Following reviews published by Innovate UK1 and Nature2, it is widely accepted that the majority of drugs are ineffective in most patients. The future of targeted prescribing now relies heavily on pharmacogenomics, or how genetic variation between patients leads to differences in drug response. Pharmacogenomics has not only increased our knowledge of the relationship between pharmacology and genomics; it has also improved our understanding of how drugs deliver their therapeutic benefits.
But while the cost of genomics studies has fallen, there remains a missing link: understanding human pharmacology at an earlier stage in the drug development process. One of the most powerful tools we can use to achieve this is human tissue testing.

Revolutionizing the way medicines are developed and selected for patients.
What is human tissue testing?
Human tissue testing, or human ex vivo research, is any research that uses whole human tissues or primary cells to predict drug behavior. Tissues are typically obtained post-mortem from organ donors, but can also be donated by patients undergoing cosmetic or medical surgeries. While it may sound like a novel approach to drug development, human tissue testing uses technologies that have been championed for decades, such as organ baths and Ussing chambers.
Due to their complexity, human ex vivo assays are representative of local disease biology and generate powerful data that can be used to translate results from animal models to humans. Human tissue testing, therefore, represents the missing link between in vivo testing and clinical trial. These human-based systems also allow pharmacological data to be analyzed alongside donor data, including donor demographics, medical history, genomics, and transcriptomics. This synergy of human and pharmacological data, therefore, has the potential to better inform patient selection for clinical trials - in this article, we'll explain how.
 |
 |
 |
 |
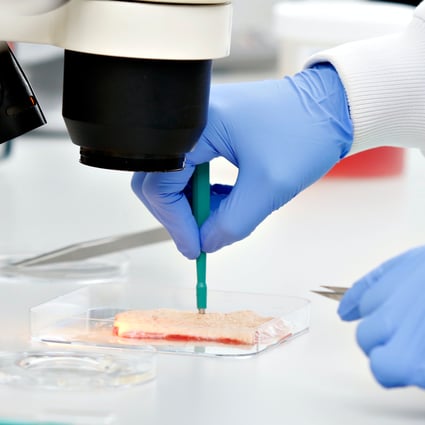
| 1. Fresh tissues are transported to the laboratory | 2. Scientist isolates the structure of interest | (e.g. small blood vessels) | 3. Living tissues are exposed to test articles |
How can human tissue testing enhance precision medicine strategies?
Typically, precision medicine strategies aim to stratify patient populations after clinical trials. But with human tissue testing, stratification can be performed at a much cheaper, earlier stage. By combining tissue donor data with the pharmacological data from tissue testing, there are a number of stratification questions we can answer preclinically:
- How do patients, from a specific cohort of the disease, respond to a drug?
- What kind of SNPs are associated with COPD or IBD patients?
- How do patients taking a specific drug, such as steroids, respond to a novel drug with a similar mechanism?
This is just an example of some of the associations that can be made using human tissue testing.
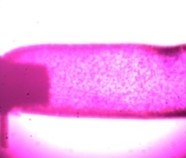
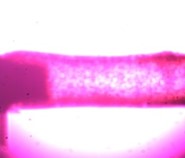
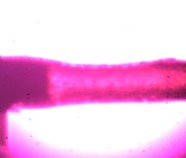
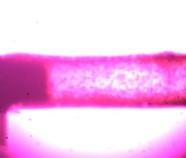
| 0 min | 5 min | 10 min | 15 min | 20 min | 25 min |
 |
 |
 |
 |
 |
 |
| Constriction (↑ Blood Pressure) | Relaxation (↓ Blood Pressure) | ||||
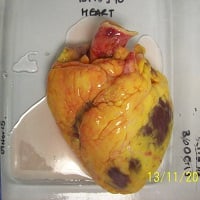
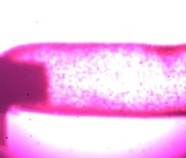
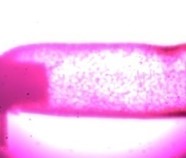
Figure 1: Here we see a drug affecting the lumen of a small blood vessel that has the potential to alter blood pressure. This concept can be applied to almost every tissue type including heart, lung, skin, bowel, bladder, and many more.
Example: Asthma and β-Adrenoceptors
At REPROCELL (Biopta), a tissue commonly used for ex vivo pharmacology studies is bronchi from human lungs. We can measure inflammatory cytokine release or contraction/dilation in response to test drugs (with standard-of-care compounds as controls) in these tissues.
For one study, we used human bronchi from three asthma patients to created concentration-response curves (CRCs) to formoterol and salmeterol. These compounds are standard-of-care drugs for asthma that deliver their therapeutic benefits via β-adrenoceptors.
Formoterol showed a similar response across all three patients (figure 2A), however, salmeterol did not. Instead, salmeterol showed one high-responder, one low-responder, and one non-responder (figure 2B).
This varied response to salmeterol is often reflected in the clinic with some patients responding well to treatment with the drugs and others who do not. Reduced drug response in non-responders is typically due to a mutation in β-adrenoceptors that affects sensitivity to salmeterol but not other beta-agonists, such as formoterol.
| A | 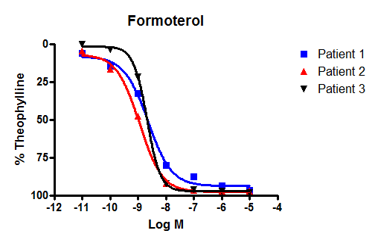 |
B | 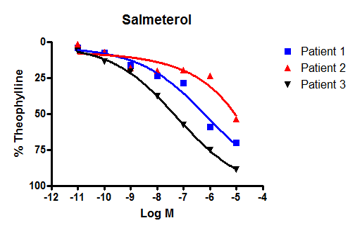 |
|
Figure 2: We observed bronchodilatation to increasing concentrations of two beta-adrenoceptor agonists, formoterol and salmeterol in human isolated airways from three separate individuals. A: All donors responded to formoterol. B: By contrast, only patients 3 and 2 responded to salmeterol - patient 1 was a poor responder. Differences in the response to salmeterol are explained by variations in patient genotype that affect β-adrenoceptor sensitivity. |
|||
Case Study: Precision medicine, human tissue testing, and ’omics
So if inter-patient variation in drug response can be predicted in human tissue, why not make use of this early stratification to improve drug prescribing? Could we use human tissue testing to identify genes that affect human drug response before clinical trial?
To find out, we would need to rally a range of experts in pharmacology, genomics, and bioinformatics. The resulting study involved mass collaboration between academic, industry, and medical industries across Scotland.
Below, co-authors Graeme Macluskie (REPROCELL) and Max Bylesjo (Fios Genomics) outline the human tissue and bioinformatics techniques used in this first-of-a-kind study3.
What was the aim of this research?
The main objectives of this study were to demonstrate the ability to better improve patient stratification strategy prior to clinical trials and use human tissue testing and the associated 'omics and patient data to achieve this.
Tell us more about the human tissue model used
We knew that selection of the test system was critically important for generating quality data. Any patient stratification outputs generated from this study would depend on model selection. As human tissue testing acts as a proxy for disease biology and drug response, we believed that using whole, primary tissues from the patient population would be the most representative. The explant model we chose had the complexity of lung tissue, its cellularity, and was functional for an adequate period of time - plus multiple end-points were possible, such as cytokine measurement or gene expression.
To procure the tissues required for our explant model, we identified COPD patients undergoing surgeries where a piece of lung tissue would be removed. We had to ensure that the patients could provide informed consent and that the tissue could be used for research purposes. The NHS allowed us access to data safe-havens which include the electronic health records of people in Scotland. Through these safe havens, we could access detailed donor demographic information above and beyond the norm, including medical and drug histories.
Measuring drug response in COPD
As this project focused on COPD, we decided to use cytokine measurement to determine drug response. Specifically, we chose to look at pro-inflammatory cytokine TNFα because it:
- Has been measured in sputum samples from COPD patients (Barnes, 2016)
- Is elevated following COPD exacerbation (Barnes, 2016)
- Is a good predictive biomarker of airway infection (Bathoorn et al, 2009)
Like other in vitro systems, human tissue models sometimes require a stimulant to maintain their disease phenotype. In this project, we used the stimulant lipopolysaccharide (LPS) to mimic the inflammation caused by bacterial exacerbations of COPD. LPS is a bacterial endotoxin that acts as a pro-inflammatory stimulant via agonism of toll-like receptor 4 (TLR4). By choosing LPS as our stimulant and TNFα as our end-point, we could mimic the most common type of COPD exacerbation observed clinically.
Validating the COPD model
Below, we have included some of the data we generated to validate the use of LPS in the system (figure 3). To ensure that LPS was a suitable stimulant we took ten donor samples and split the resultant lung biopsies into two groups: the first with media only and the second with LPS added. We then cultured these over time and measured the amount of TNFα released from these biopsies.
Each of the donor measurements is linked by a line, so even though there is already a high baseline level of TNFα in these diseased samples, LPS increases the levels of TNFα further. This mimics clinical observations made by Barnes (2016) who found increased levels of TNFα in sputum samples from COPD patients following an exacerbation4.
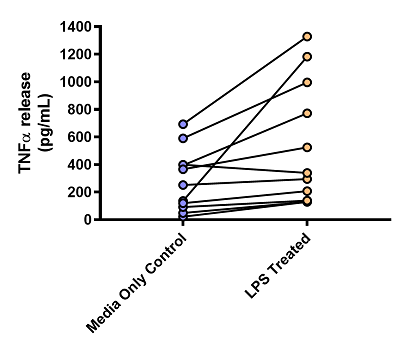
Figure 3: Graph showing the effects of LPS on TNFα release from human lung parenchyma biopsies. n = 10 donors, all diagnosed with COPD. Data is displayed as a pg/mL of TNFα. Each dot represents the mean result of an individual donor, with the paired results from each donor linked by a line.

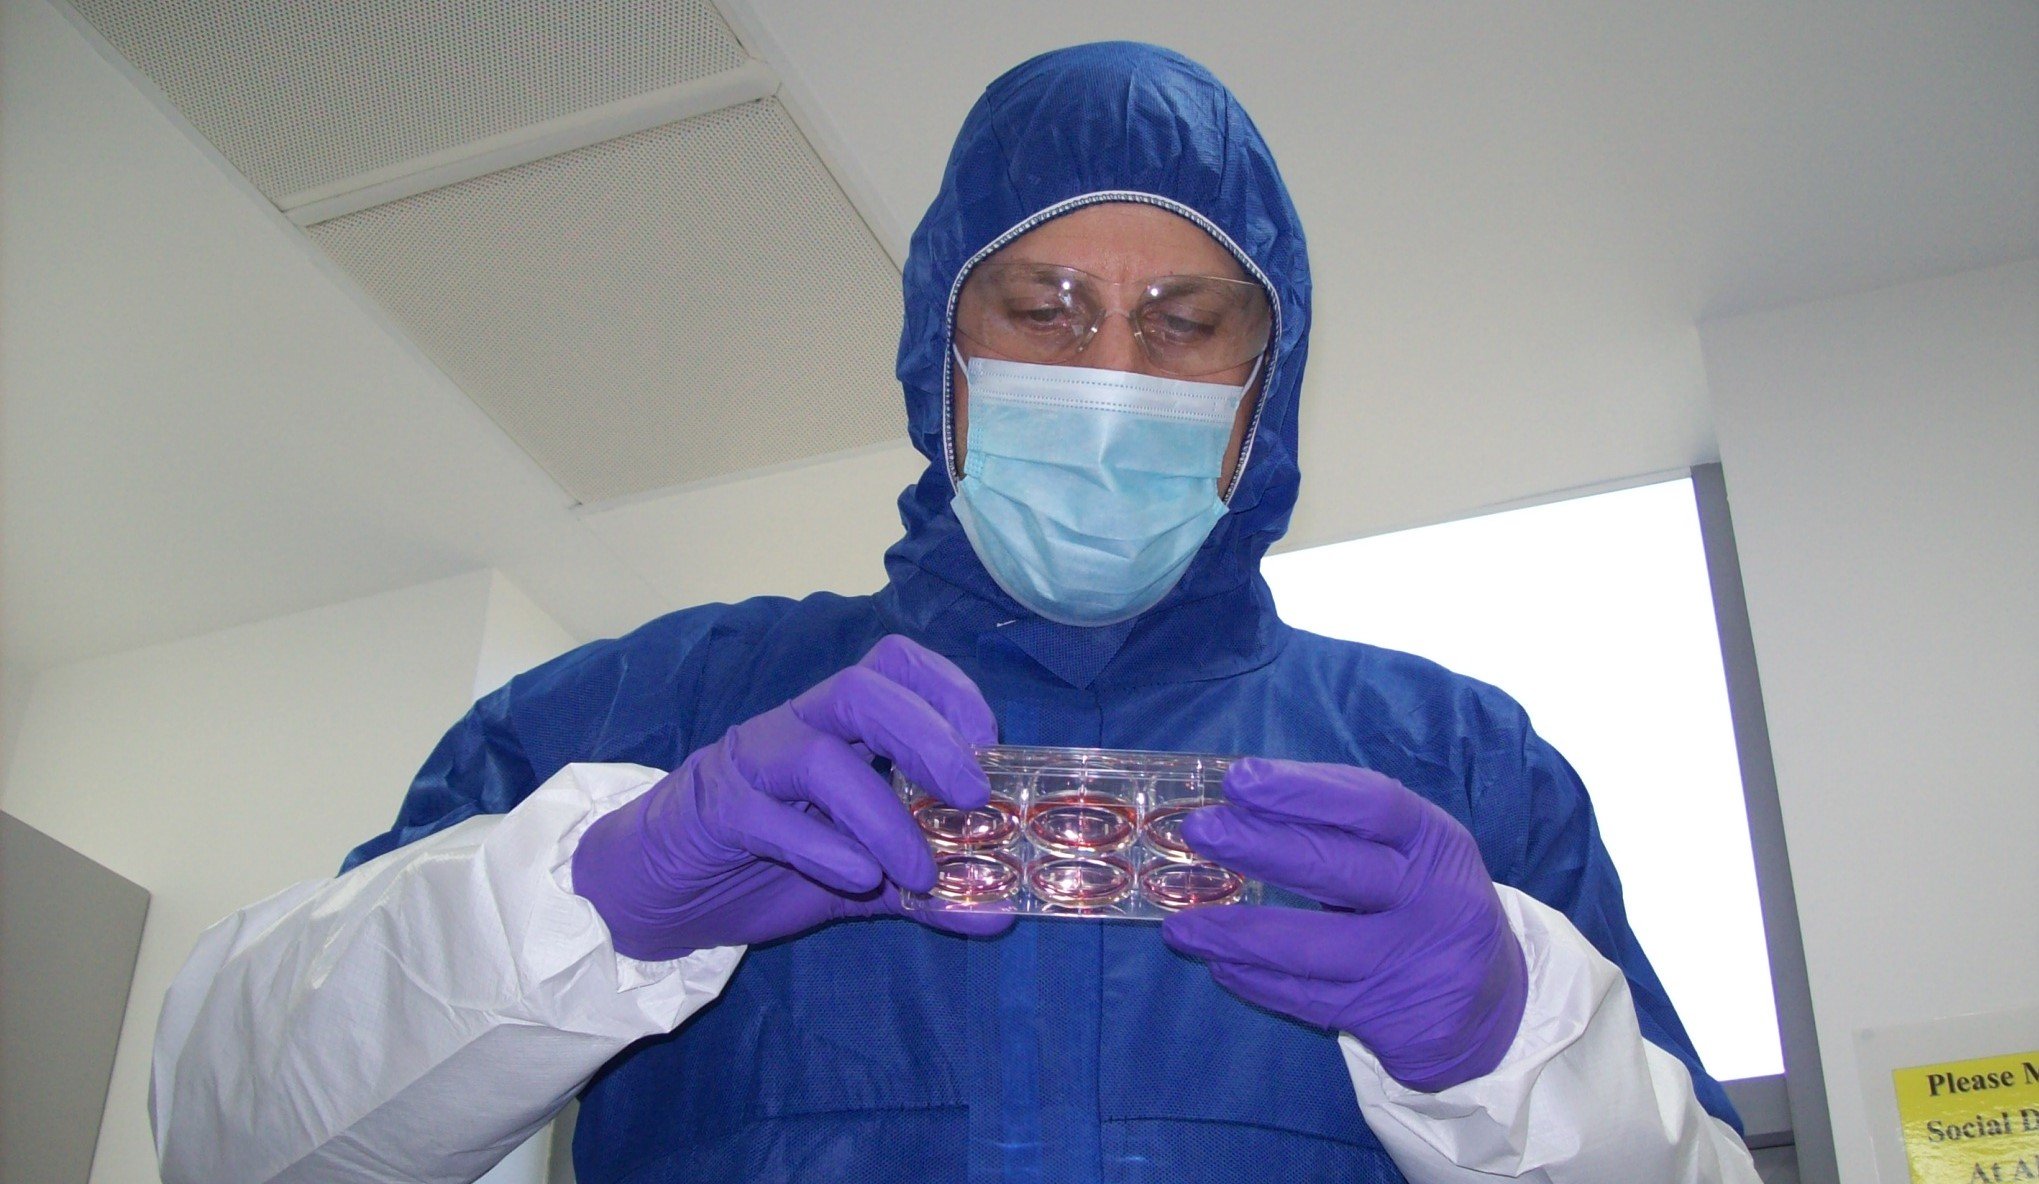
REPROCELL’s contract research services use human living tissues to better predict drug safety and efficacy.
Generating pharmacology data from human COPD tissue
For this study, we wanted to show differences in drug response across a range of standard-of-care therapies for COPD rather than just one or two. However, any expected mechanism of the drugs would have to correspond with how we stimulated the culture (LPS) and the end-point we were measuring (TNFα). Therefore, we chose the following standard-of-care drugs for our pharmacology experiments:
- Roflumilast (100nM): PD4 inhibitor and anti-inflammatory compound used in adults with frequent exacerbations of COPD. Shown to inhibit LPS induced TNFα production ex vivo (Buenestado et al, 2013).
- Fluticasone (1mM): Cortical steroid used as a maintenance therapy to suppress inflammation. Some COPD patients express insensitivity to steroids or a change in sensitivity over time.
- Formoterol (10nM): β-agonist used to relax airways in COPD. Formoterol may have anti-inflammatory effects in some patients and could enhance the therapeutic efficacy of other anti-inflammatory drugs.
These drugs were added to the culture media at the specified concentration and then incubated with the COPD tissue for up to seven days. The media was then aspirated and TNFα levels were measured to estimate drug response.
 |
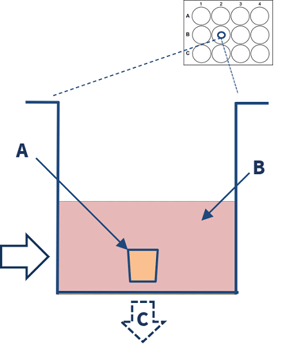 |
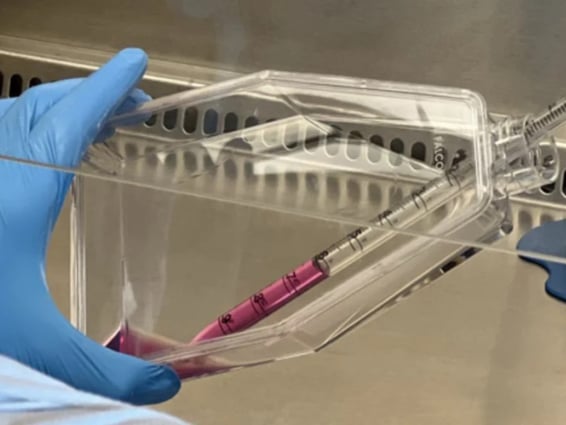
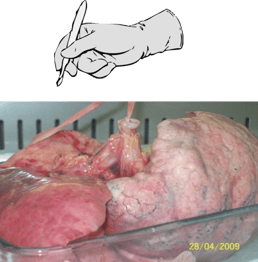
| 1. Multiple human lung parenchymal explants (3-5mm3) are dissected from diseased COPD lung tissue. | 2. The explants (A) are placed in a 12 well-plate containing culture media, stimulants, and or drugs (B). End-point analysis (C) includes cytokine measurements and gene expression. |
Results from pharmacology experiments
In the roflumilast and fluticasone treatment groups, we observed a significant decrease in the mean TNFα levels of all patients. We also observed a significant decrease in mean response to the combination roflumilast-formoterol therapy. However, treatment with formoterol alone did not reduce average cytokine levels across donors (figure 4A).
Despite this result, we knew that formoterol displayed anti-inflammatory effects in a percentage of patients. This inter-patient variation was observed more clearly when we plotted the mean response of each donor individually on a scatter plot (figure 4B). While there was a variance in patient response between each test condition, there was also further inter-patient variation within each treatment category, as visualized below:
- Figure 4A: Each bar represents the mean of the result of all 25 donors in each test condition, plus or minus the standard error. As expected there is a reduction in TNFα levels compared against the control (DMSO).
- Figure 4B: Each individual dot on the scatter plot represented the mean drug response for one donor. As 25 donor samples were used (i.e., 25 individual COPD donor lungs), there are 25 dots per test condition.
| A | 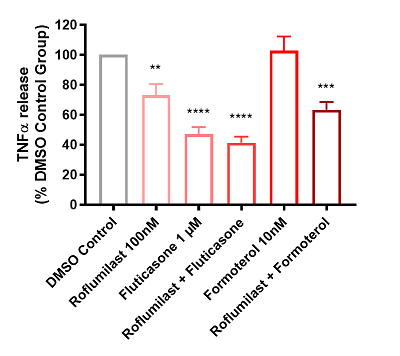 |
B | %20and%20mean%20(black%20line)%20TNF%CE%B1%20release.png?width=400&name=Scatter%20graph%20depicting%20individual%20patient%20(dots)%20and%20mean%20(black%20line)%20TNF%CE%B1%20release.png) |
|
Figure 4: Graphs showing the effects of test articles on TNFα release from LPS stimulated human lung parenchyma biopsies, n = 25 donors diagnosed with COPD. Data is displayed as a percentage of the corresponding DMSO control group in both graphs. A: Bar graph depicting mean + SEM TNFα release. B: Scatter graph depicting individual patient (dots) and mean (black line) TNFα release. |
|||
Relating pharmacological data to bioinformatics
As before, we found that response to drug treatments varied between donors. However, this time, we didn't know the exact reason why. We already had donor demographics and medical histories from the NHS, but we also wanted to investigate genetic factors that could be influencing drug behavior. So we extracted RNA from each donor sample for micro-RNA (miRNA) expression profiling and whole-exome sequencing.
Once generated, this 'omics data was stored via an external provider, until it could be used to identify relationships between drug response and genotype. The Scottish-based bioinformatics company Fios Genomics was responsible for performing this analysis, alongside Professor Collin Palmer: an expert on pharmacogenomics in lung disease.
Identifying treatment responders
At Fios Genomics, they began bioinformatics analysis by identifying donors who had responded to drug treatment. As TNFα release was used to measure drug response, all donors who demonstrated TNFα suppression in response to a treatment group were classed as "responders" (figure 5A). However, not all of these drug "responders" displayed the same intensity of response. In the roflumilast-fluticasone treatment group specifically, we identified two distinct data “peaks” which could be used to separate "high-responders" from "low-responders" (figure 5B).
| A | 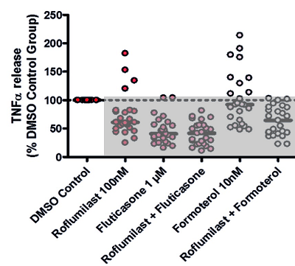 |
B | 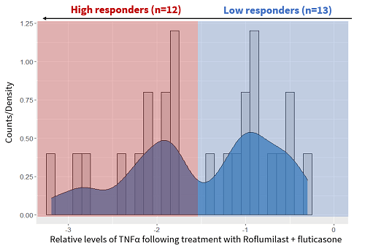 |
|
Figure 5: Graphs showing how we classified donors by drug response. A: TNFα values normalized against the DMSO control (100%) All donors displaying below the 100% line are drug responders. B: In the roflumilast-fluticasone treatment group, there were two distinct types of responders. High-responders (n=12) are highlighted in red, while low-responders (n=13) are blue. |
|||
Why were there differences between drug responders?
Several factors could have influenced inter-patient differences observed in the roflumilast-fluticasone treatment group. These included:
- Demographic and medical factors e.g. sex, age, ethnicity, etc.
- Differences in micro-RNA (miRNA) expression
- Donor genotype e.g. heterozygote, homozygotes etc.
Demographic and medical factors
[MAX] We looked firstly at the demographic data, provided by the NHS, to explain this variation (figure 6). While some associations were made between donor age and ethnicity in other treatment groups, no significant pairs were identified for roflumilast-fluticasone. In other words, differences in demographic factors could not explain the varied drug response in this treatment group.
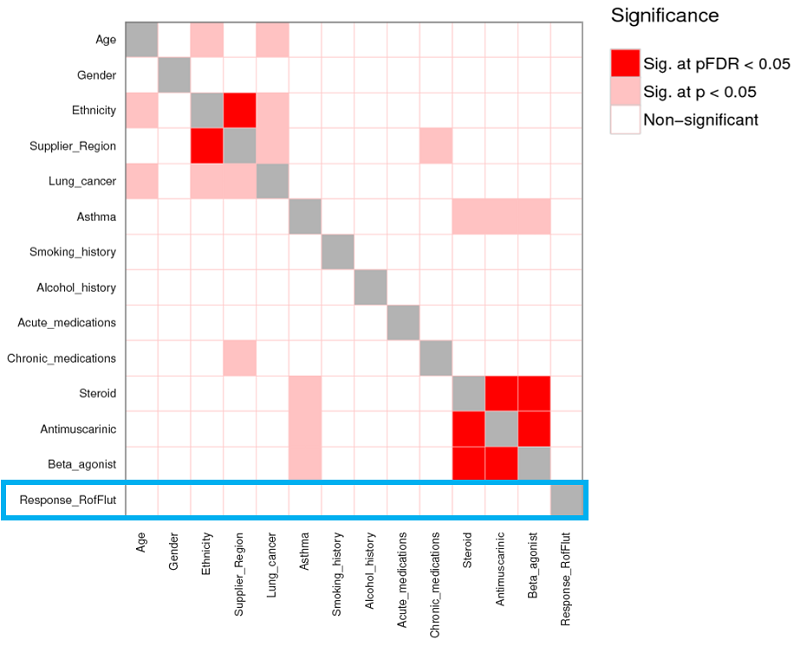 |
| Figure 6: Statistical analysis was performed to assess whether the differences between high/low responders could be explained by demographic information. While some significant associations were made in other treatment groups, demographics did not explain the difference in response to treatment with roflumilast-fluticasone (highlighted in blue) |
miRNA expression
[MAX] Next, we looked at the miRNA dataset to explain differences in drug response. If you are not familiar with miRNA, these small RNA molecules function primarily in silencing mRNA, thus preventing gene expression. By identifying differences in miRNAs expression between high and low drug responders, we could identify cellular pathways that may be responsible for variations in drug response.
A total of 181 miRNAs were identified as having significantly different levels of expression between the low and high responders (figure 7). The next step was to identify the pathways these miRNAs were involved with, and how this was related to COPD pathology. One of the main outcomes noted from this analysis was the upregulation of the TGFβ signaling pathway.
Smad3, a target of a significant miRNA we identified previously (miR-18a), was thought to be primarily responsible for this upregulation. In the literature, TGFβ and SMAD3 have been implicated in the pathology of COPD. Roflumilast is also known to affect the regulation of the TGFβ pathway, giving our pharmacology data context but alongside findings from previous COPD studies.
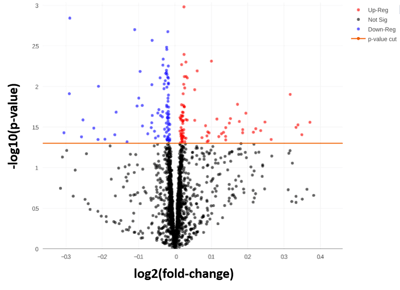
Figure 7: To allow a very tentative interpretation of the results (taking into account the low sample number) an uncorrected p-value of < 0.05 was used. Uncorrected here means that it is not correcting for multiple corrections and the inflation coming from that. 181 miRNAs were significant at this threshold.
Donor genotype
Finally, we proceeded to explore differences in drug response using the whole-exome sequencing data. The workflow for genotyping data is very similar to the miRNA in the sense that we are asking the question “What genes could explain differences between the high and low response groups?” From this, we identified 30 significant SNPs, mapping to 23 genes associated with drug response. Interesting, Smad3 was one of them. Another significant gene identified was CYP2E1, one of the p450 proteins linked to COPD pathology.
Below, the genotyping results for Smad3 and CYP2E1 are illustrated:
- Figure 8A: Outlines the genotypes response criteria for Smad3. When the donor genotype is “A/A” the whole column is blue, indicating that patients with this genotype are low responders. The same is true for the heterozygotes (A/G). However, donors with the genotype "G/G" are a mix of high and low responders.
- Figure 8B: The Smad3 data, tabulated. In this figure, we can see the spread of data. As before, low responders are either A/A or A/G genotype. Donors with the G/G genotype are more evenly spread between the two but are predominantly high responders.
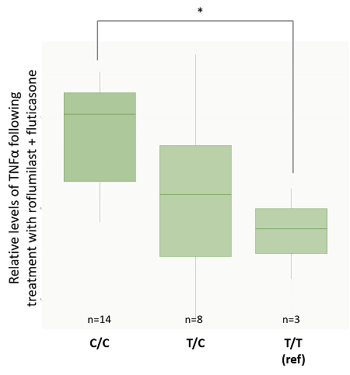
- Figure 8C: Outlines the genotypes response criteria for CYP2E1. All donors with the genotype "T/T" are high-responders to roflumilast-fluticasone treatment, while heterozygotes with the "T/C" genotype are predominantly high-responders. Donors with the "C/C" genotype are mainly low-responders.
- Figure 8D: The CYP2E1 data, tabulated. As before, the tabulated data shows the spread of data between the different CYP2E1 genotypes and response groups.
| A | 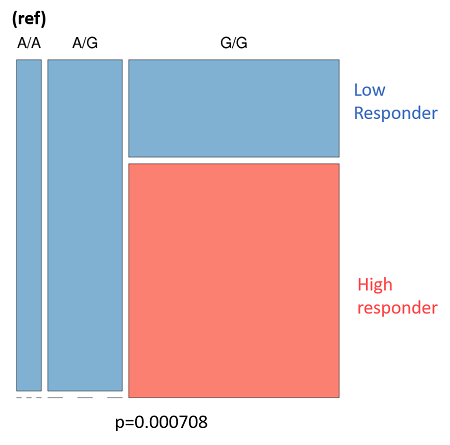 |
B | 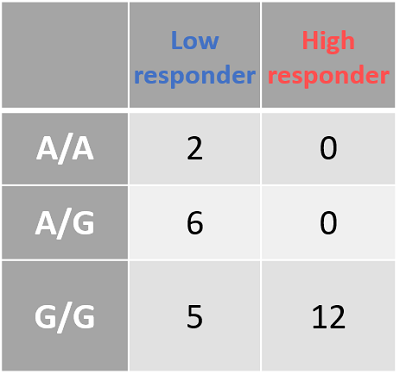
|
| C | 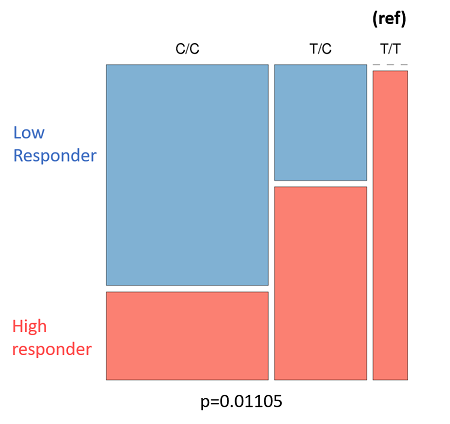 |
D | 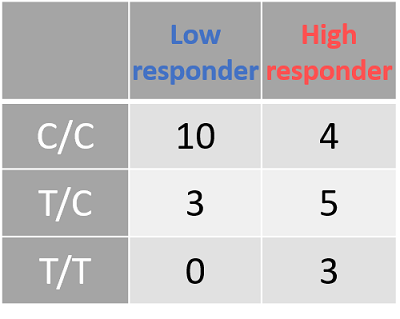
|
| Figure 8: The genotyping information for Smad3 (rs1065080) and CYP2E1 (rs2249695). Due to the low sample number (n = 25) we looked at an uncorrected p-value of .001 A: Smad3 genotype (ref) is listed at the top. Low-responders are in blue, and high-responders are in red. B: The same information in A, but tabulate to better present the spread of data. C: CYP2E1 genotype (ref) is listed at the top. Low-responders are in blue, and high-responders are in red. D: The same information in c, but tabulate to better present the spread of data | |||
Linking donor genotype to clinical phenotype
While these results do not fully separate the response groups by genotype, they do suggest an association between donor genotype and clinical phenotype. We wanted to double-check that the same conclusion could be achieved when we separated donors by genotype and looked at TNFα suppression. For Smad3, the G/G genotype had significantly lower TNFα values than A/G individuals, as found during genotype analysis (figure 9A). For CYP2E1 genotypes, results also matched those from the genotype analysis with C/C donors having significantly lower levels of TNFα expression than T/T donors (figure 9B). These results produced a particularly interesting gradient if we consider how genotypes and phenotypes are related.
| A | 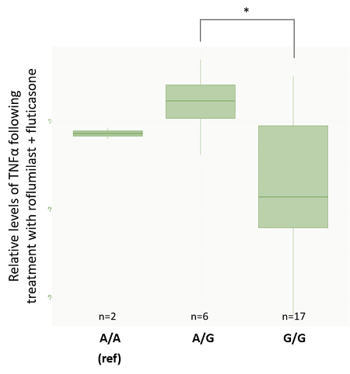 |
B |
|
|
Figure 9: TNFα values are normalized against the DMSO control. *significant at p<0.05. A: rs1065080 (Smad3) barplot. B: rs2249695 (CYP2E1) barplot. Interestingly, this analysis showed a trend from low TNFα suppression in the C/C genotype to high-responders with a T/T genotype. This gradient is particularly interesting from the perspective of understanding how genotype and phenotype are related. |
|||
Key findings of this precision medicine study
- Human tissue testing can be used to understand how COPD patients respond to standard-of-care drugs.
- Individual patient responses varied widely for some treatments, and donors were split into high, low, or non-responders.
- By matching drug response with donor genotype and miRNA expression, 23 genes were identified as contributors to inter-patient variation, including Smad3 and CYP2E1.
- Cellular pathways containing these components have been linked to COPD pathology and drug mechanisms in the literature.
Preclinical patient stratification is possible
In this article, we have discussed how human tissue testing can provide an early indication of patient drug response - specifically in the field of precision medicine. Providing patient stratification data at an earlier stage can improve precision medicine strategies by reducing recruitment costs and providing proof-of-concept data before seeking funding for human trials. Although limited in sample numbers, our case study demonstrates the power of these preclinical stratification strategies and describes how this can be achieved in practice.
If you are interested in using human tissue testing to improve your precision medicine strategies, please get in contact with our friendly team. We have provided some additional resources below if you are keen to learn more about the COPD studies mentioned in this article.
References
- Innovate UK website
- Schork, N. Personalized medicine: Time for one-person trials. Nature 520, 609–611 (2015)
- Cowan et al. Application of pharmacogenomics and bioinformatics to exemplify the utility of human ex vivo organoculture models in the field of precision medicine. PLoS One. (2019)
- Barnes. Inflammatory mechanisms in patients with chronic obstructive pulmonary disease. Journal of Allergy and Clinical Immunology (2016)
- Bathoorn et al. Change in inflammation in out-patient COPD patients from stable phase to a subsequent exacerbation. International Journal of COPD (2009)
- Buenestado et al. Roflumilast Inhibits Lipopolysaccharide-Induced Tumor Necrosis Factor-α and Chemokine Production by Human Lung Parenchyma. PLoS One (2013)

Author
Zara Puckrin, BSc
Zara is a GCU graduate who loves minimalism, marketing, and molecular biology. You can contact her on LinkedIn.
Stem cell and drug discovery scientists around the world are using REPROCELL’s services and products in their preclinical and clinical research.